Volumetric Regression Heatmap
 By LuxAlgoJun 22, 2026
Volumetric Regression Heatmap is an indicator on Vela, our next-generation charting platform, written in Pine Script®.
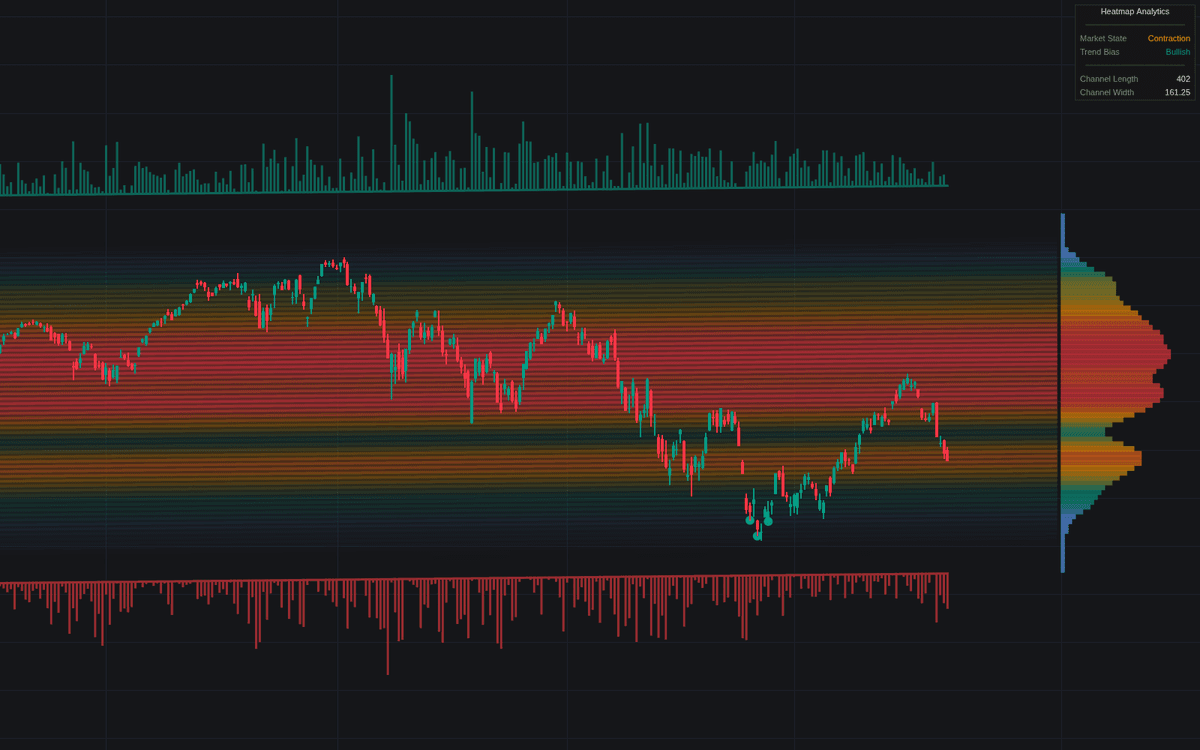
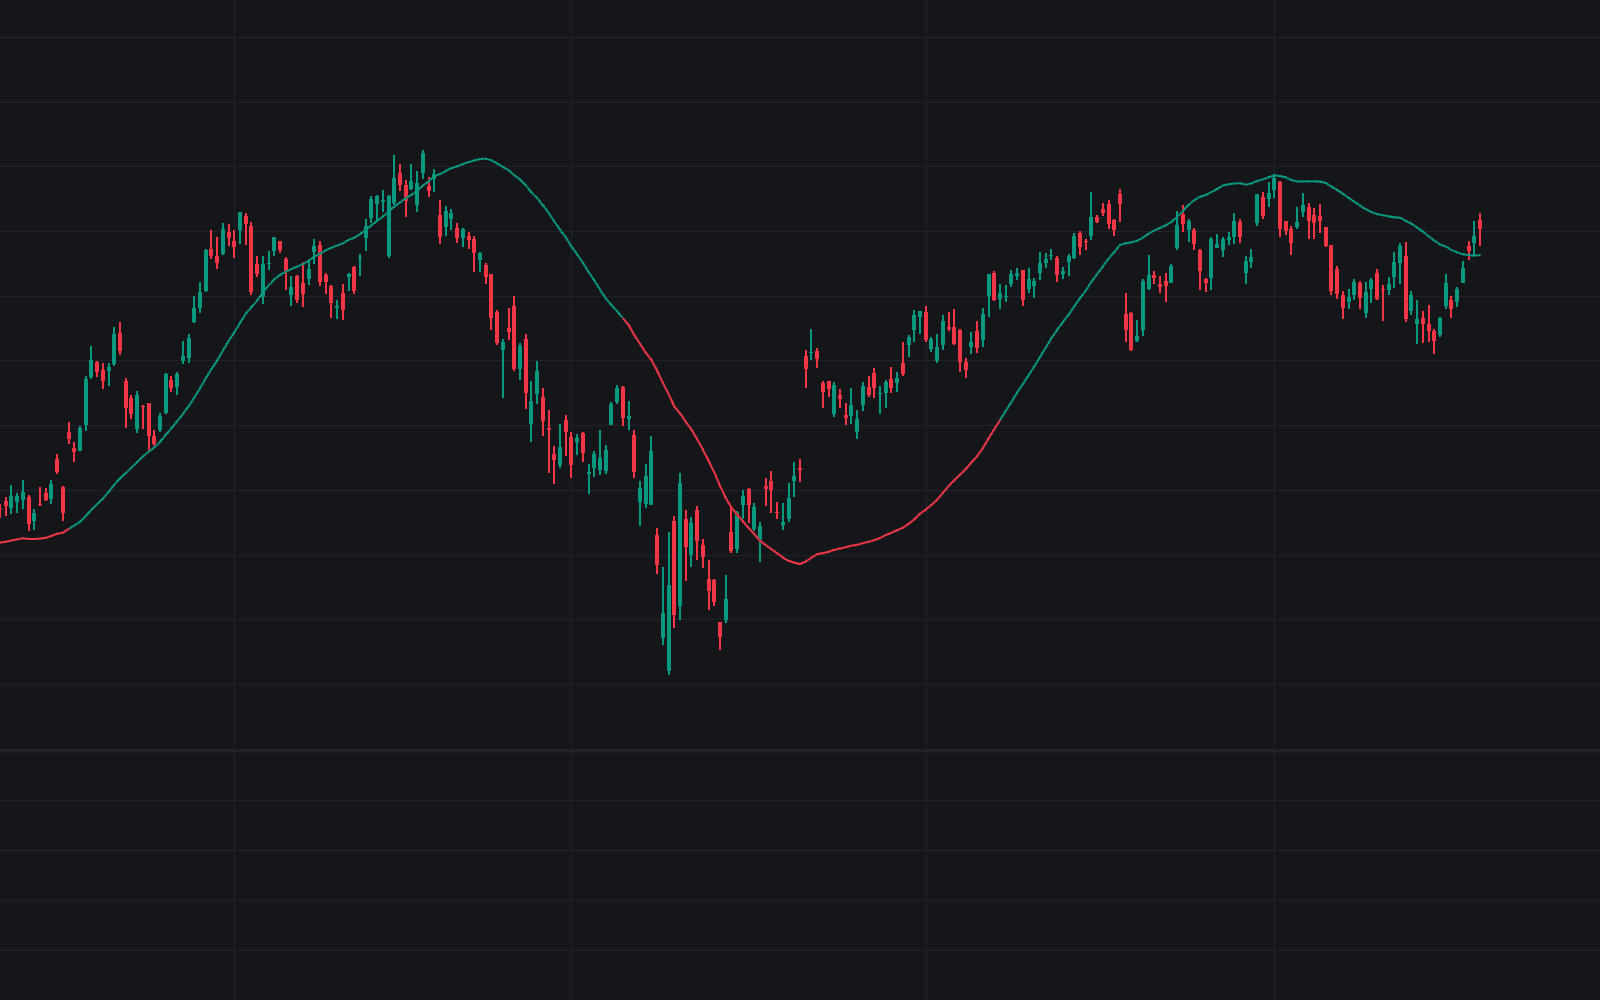
Volumetric Regression Heatmap bins traded volume by its distance from a fitted regression channel midline and paints the result as heat bands around the trend. Higher-intensity bands mark where the market traded heavily relative to the fit, Gaussian smoothing keeps the gradient readable, and the fit's period expands or contracts with an ATR-based volatility ratio so the channel stays relevant as conditions change. A projection extends the structure into upcoming bars as a map of where price statistically tends to gravitate.
How to Trade the Volumetric Regression Heatmap?
- High-intensity bands: volume-dense zones around the trend, liquidity that tends to slow an approach or provoke a reaction rather than let price slice through.
- Mean-reversion signals: mark closes that crossed beyond the upper or lower standard-deviation band, and print only while the current fitted channel is flat (its total rise below the Flat Slope Threshold times its standard deviation); a lower-band signal reads as oversold within the channel, an upper-band signal as overbought. The whole set is redrawn against the latest fit, so past signals can shift or disappear as the channel updates; treat them as context within the current channel rather than fixed entry points.
- Delta histograms: bars along the channel's top and bottom show estimated buying and selling volume, split by where each bar closed within its range, as a read on whether pushes away from the midline carry pressure.
Volumetric Regression Heatmap Settings
- Source / Base Period: the input series and the standard regression window.
- Dynamic Auto-Adjusting Period: lets volatility shorten the fit in fast markets and lengthen it in stable ones.
- Grid Rows Each Side / Gradient Smoothing / Heatmap Colors: band count per side, gradient smoothing, and palette.
- Signal Band (SD Multiplier) / Flat Slope Threshold: the deviation level that triggers signals, and the maximum channel height allowed for them to print.
- Display extras: delta histogram scale and width, Future Projection Length, an edge-of-chart volume profile histogram, and the dashboard with position and size options.
Frequently Asked Questions
Free to use
Run it on Vela. Go further with a paid plan.
- Up to 500 strategy alerts, with webhook automation
- Up to 10× the chart history of Free
- Orderflow lookback up to full history
- More Quant usage to customize it, plus extra usage when you need it
- Futures data alongside crypto, stocks, forex and commodities
Also works on

Related indicators
All 6 Linear-regression Channel indicators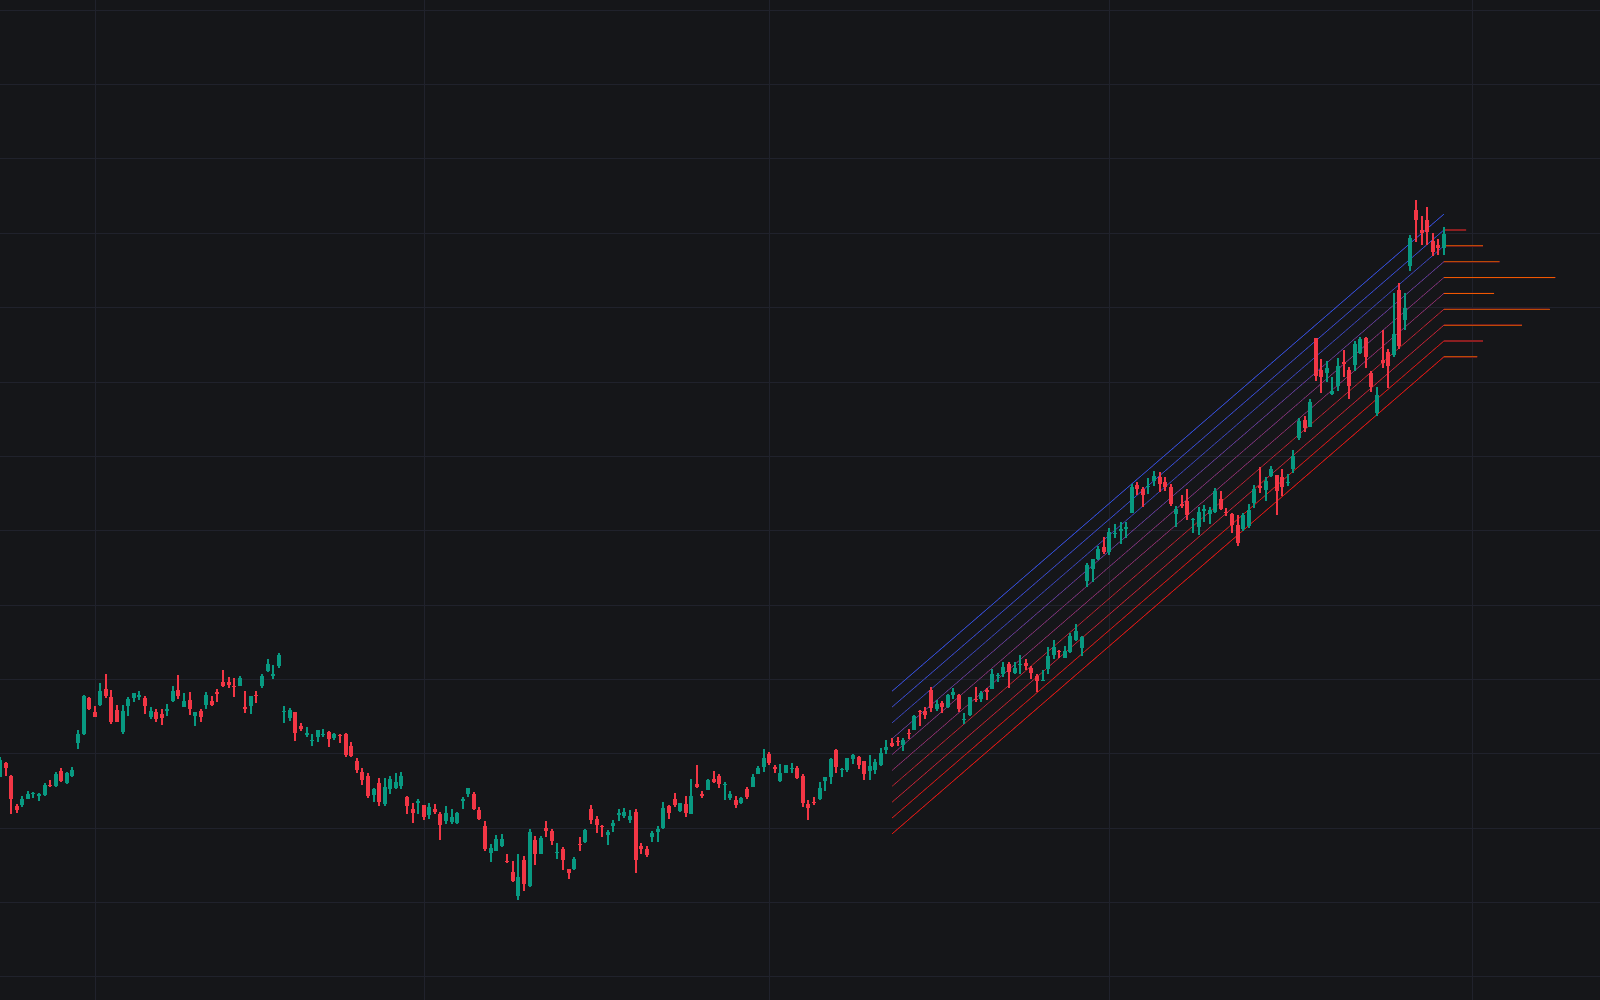
Run it on Vela. Make it yours with Quant.
Open this indicator free on Vela, our next-generation charting platform. Then ask Quant, our coding agent built into Vela, to retune it or turn it into a backtested strategy of your own.