Higher Timeframe Stochastic Buckets
 By LuxAlgoAug 17, 2026
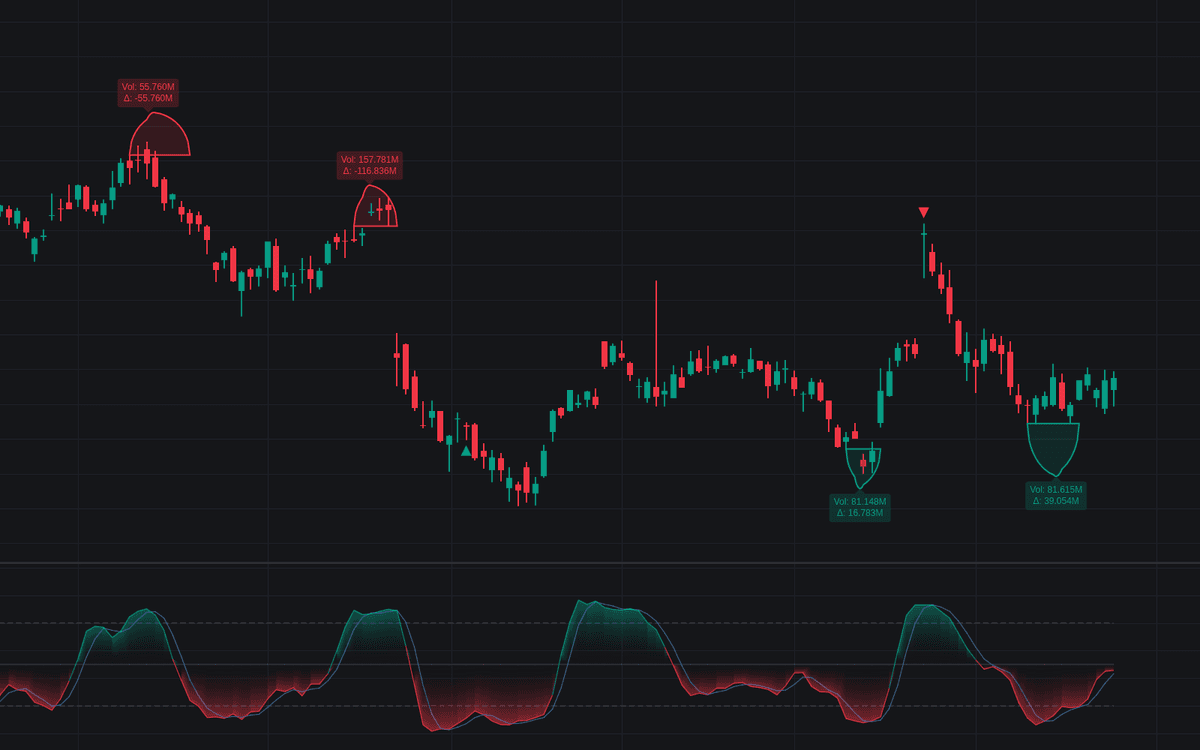

Higher Timeframe Stochastic Buckets is an advanced analytical tool that identifies market extremes by applying Stochastic oscillator calculations from higher timeframes directly onto your current chart. By mapping these oversold and overbought states as visual zones, the indicator helps traders identify areas where significant momentum exhaustion may be occurring on a macro scale. It provides a unique perspective on large scale market positioning by highlighting price regions where higher timeframe oscillators signal potential mean reversion or exhaustion, allowing for better synchronization between localized price action and broader market trends.
How to Trade the Higher Timeframe Stochastic Buckets?
Trading with this indicator involves monitoring the higher timeframe Stochastic status while looking for precise entry triggers on your primary chart. When the higher timeframe indicator enters an overbought or oversold zone, a bucket is generated to mark that region on your current chart.
To trade effectively, look for the following:
- Macro Context: Use the buckets to define areas of interest where the broader market is overextended. A bucket appearing on a daily or four-hour timeframe provides a strong structural boundary for your current timeframe analysis.
- Volume and Delta Analysis: The labels attached to each bucket display the accumulated volume and delta within that specific zone. High volume combined with significant delta divergence within a bucket can suggest a strong reversal attempt by institutional participants.
- Confirmation: Use the built-in RSI signals to identify momentum shifts within the established buckets. A triangle shape appearing within a bucket serves as a localized trigger, suggesting that price is beginning to turn in alignment with the higher timeframe extremity.
- Exit Strategy: You may choose to manage positions by looking for price closures beyond the defined bucket limits. The indicator can automatically hide these zones once they are broken, ensuring your workspace remains clean and relevant to current market conditions.
Higher Timeframe Stochastic Buckets Settings
Detection
- Higher Timeframe: Determines the timeframe used for the Stochastic calculation. For optimal results, select a value higher than your current chart interval.
- %K Length & Smoothing: Sets the lookback and smoothing periods for the Stochastic oscillator.
- %D Smoothing: Adjusts the smoothing applied to the %D signal line.
- Overbought/Oversold: Defines the thresholds for the Stochastic oscillator to identify extreme zones.
- Require %D Confirmation: When enabled, the indicator only generates buckets if both the %K and %D lines are within the extreme zone.
Buckets
- ATR Length & Depth: Configures how the bucket depth is calculated using the average true range. A larger multiplier creates deeper zones.
- Maximum Buckets: Limits the number of historical buckets retained on the chart.
- Hide Broken Zones: Automatically removes buckets if the price closes beyond the extreme level of the zone.
- Show Volume & Delta Labels: Toggles the display of trade statistics within the active bucket.
Chart Timeframe RSI
- Show RSI Signals: Enables or disables the triangle markers that appear when the current timeframe RSI meets the overbought or oversold criteria inside a bucket.
- RSI Length & Thresholds: Sets the specific parameters for the current timeframe RSI signal calculation.
Style
- Colors & Transparency: Adjusts the appearance of the buckets, including the outline width and the fill transparency for visual clarity.
Frequently Asked Questions
Free on Vela
Run it on Vela. Go further with a paid plan.
- Up to 500 strategy alerts, with webhook automation
- Up to 10× the chart history of Free
- Orderflow lookback up to full history
- Up to 100,000 monthly credits for Quant to customize it
- Futures data alongside crypto, stocks, forex and commodities

The Library is free. Quant makes it yours.
Pull any concept or indicator into Quant: rebuild it, retune it, or turn it into a backtested strategy of your own.