LTF Momentum Projection
 By LuxAlgoAug 4, 2026
LTF Momentum Projection is an indicator on Vela, our next-generation charting platform, written in Pine Script®.
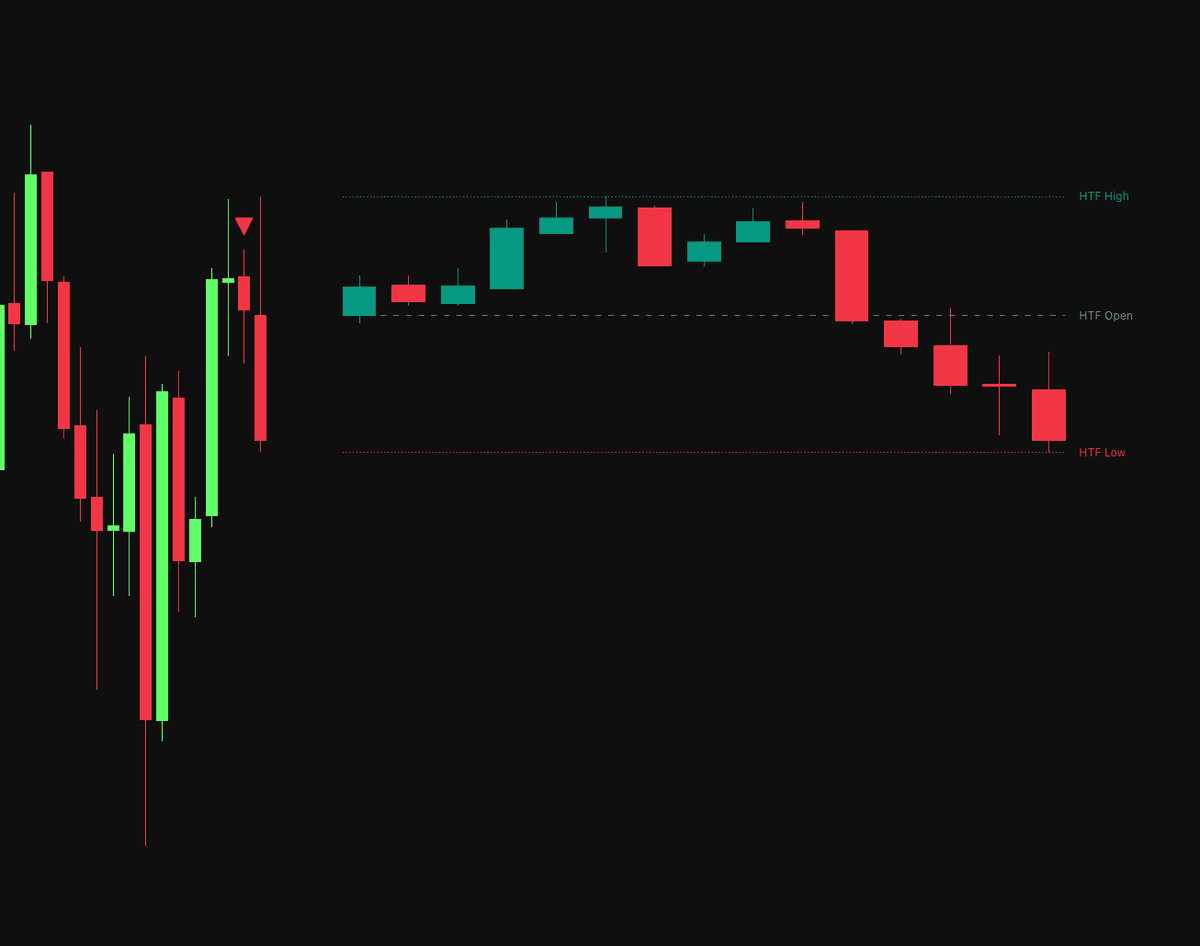

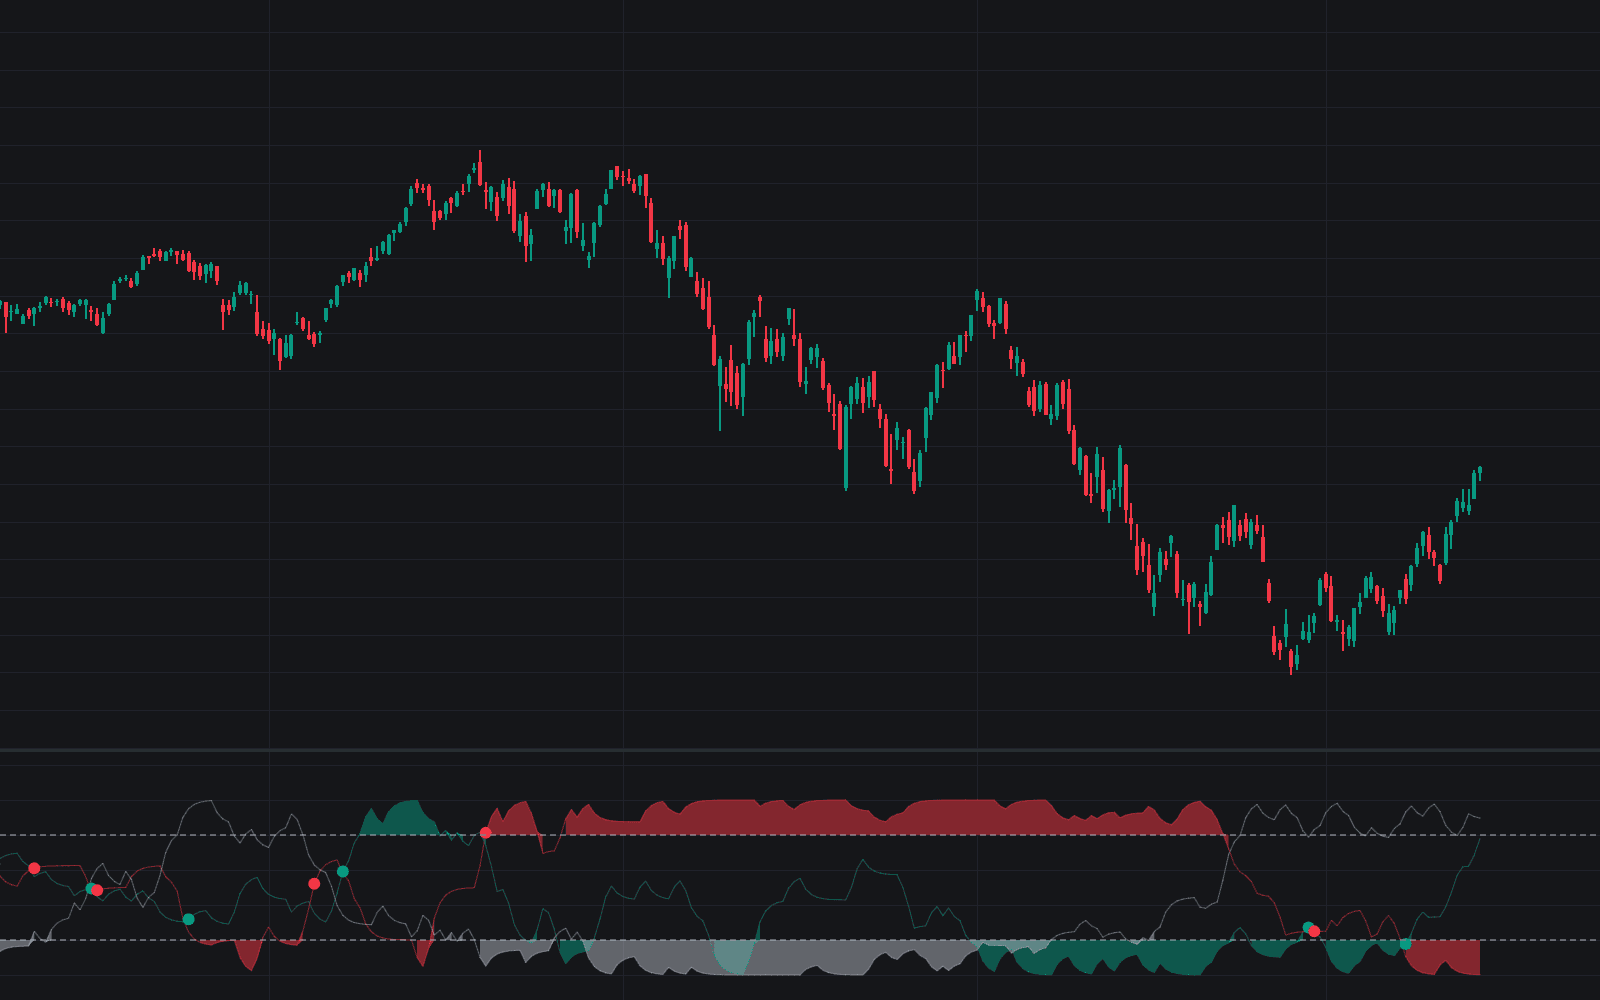
LTF Momentum Projection renders the inside of your candles: choose a lower timeframe and the indicator projects its candles next to the main chart, keeping intra-bar structure and momentum shifts visible without leaving the higher-timeframe view. Signals print on two layers: internal marks on the projected candles for micro-shifts, external marks on the main chart for shifts at your working timeframe.
The shift logic is pure price action: a thrust candle, then a same-direction exhaustion candle with a body under 60% of the thrust's, then an opposite candle that closes through the exhaustion candle's midpoint.
How to Trade the LTF Momentum Projection?
- Green triangle: a potential bullish momentum shift: thrust, exhaustion, then a confirming close back the other way.
- Red triangle: the bearish mirror, flagging fading upside drive.
- Internal signals: time entries inside the current higher-timeframe bar from micro-shifts on the projection.
- External signals: read the main-chart marks for shifts on the timeframe you are viewing.
- HTF OHL levels: optional open, high, and low lines frame the projection for instant context.
LTF Momentum Projection Settings
- LTF to Display: the lower timeframe rendered in the projection.
- Right Offset (Bars): how far from the last candle the projection begins.
- Limit Visible Candles / Amount to Show: cap how many recent LTF candles render to prevent clutter.
- Vertical Scale: how tall projected candles appear relative to the HTF opening price.
- Candle Gap: spacing between individual projected candles.
- Show External Signals (Main Chart) / Show Internal Signals (Projection) / Show HTF OHL Levels: toggles for both signal layers and the context lines.
Frequently Asked Questions
Free to use
Run it on Vela. Go further with a paid plan.
- Up to 500 strategy alerts, with webhook automation
- Up to 10× the chart history of Free
- Orderflow lookback up to full history
- More Quant usage to customize it, plus extra usage when you need it
- Futures data alongside crypto, stocks, forex and commodities
Also works on

Related indicators
All 6 Momentum indicators
Run it on Vela. Make it yours with Quant.
Open this indicator free on Vela, our next-generation charting platform. Then ask Quant, our coding agent built into Vela, to retune it or turn it into a backtested strategy of your own.