All indicators

Momentum Cycle Sentry

By LuxAlgoFeb 19, 2026

Static chart image
OscillatorsCandlestick

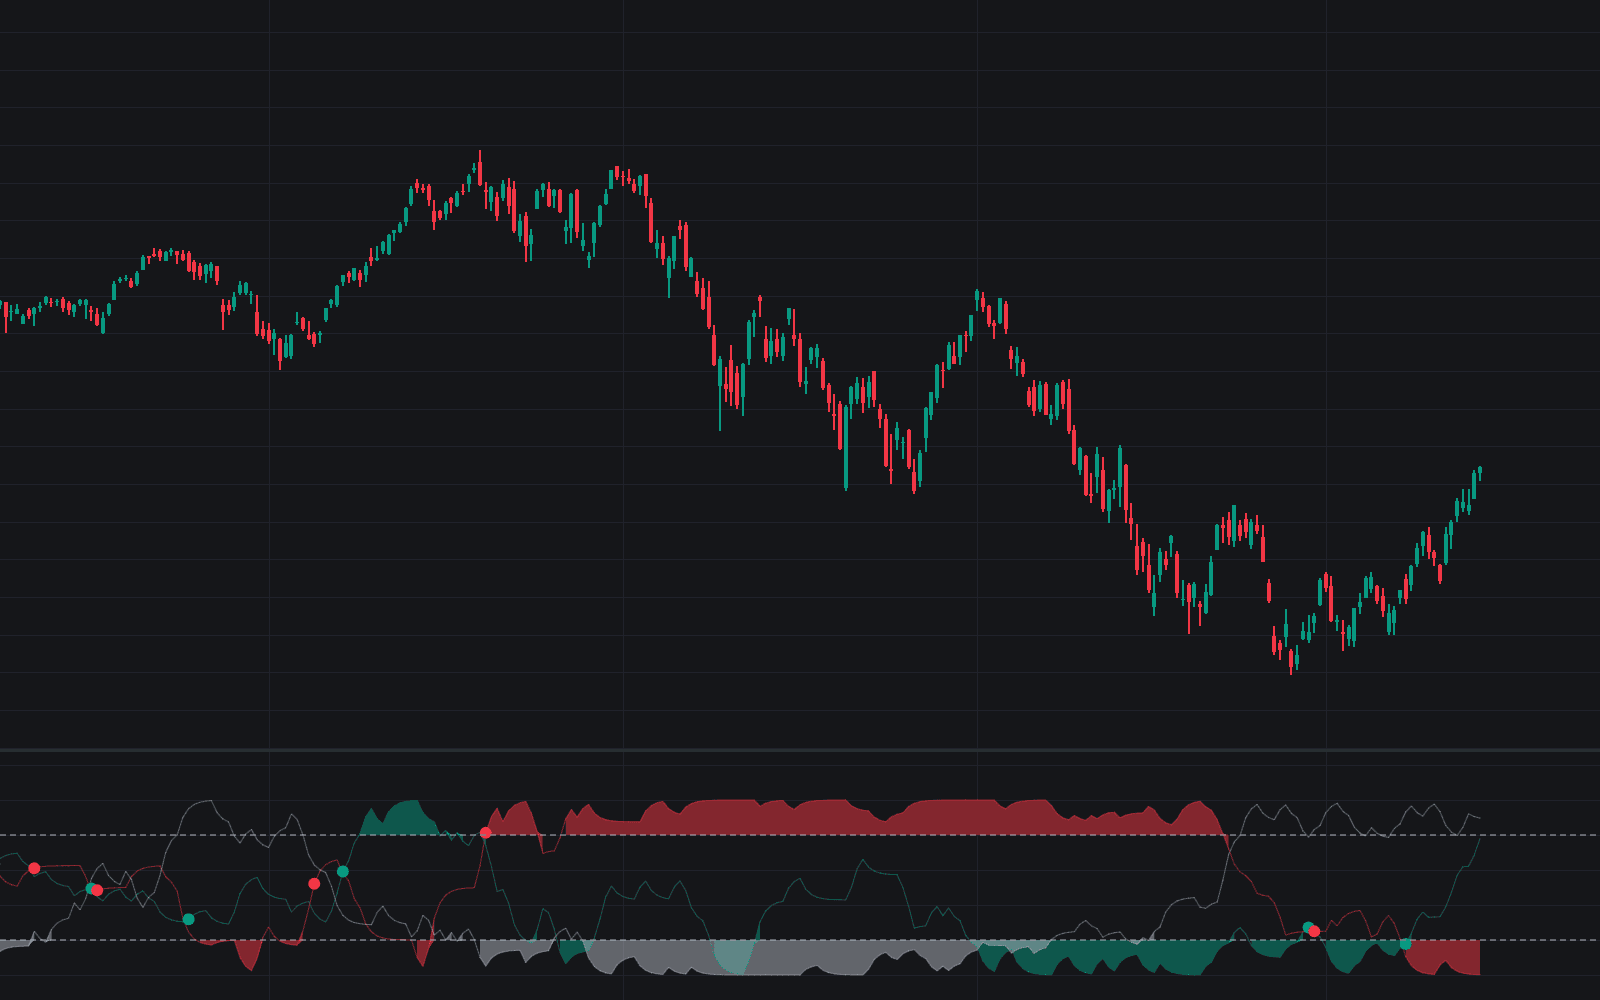
The Momentum Cycle Sentry is an advanced trading indicator built to help traders visualize momentum cycles, trend strength, volatility extremes, and retracement phases in one unified oscillator. Using a symmetric mirrored architecture and dynamic volatility corridors, this trading tool transforms raw momentum into a high-clarity visual system that makes trend expansion, pullbacks, and exhaustion zones immediately recognizable across any market or timeframe.

How to Trade the Momentum Cycle Sentry Trading Indicator

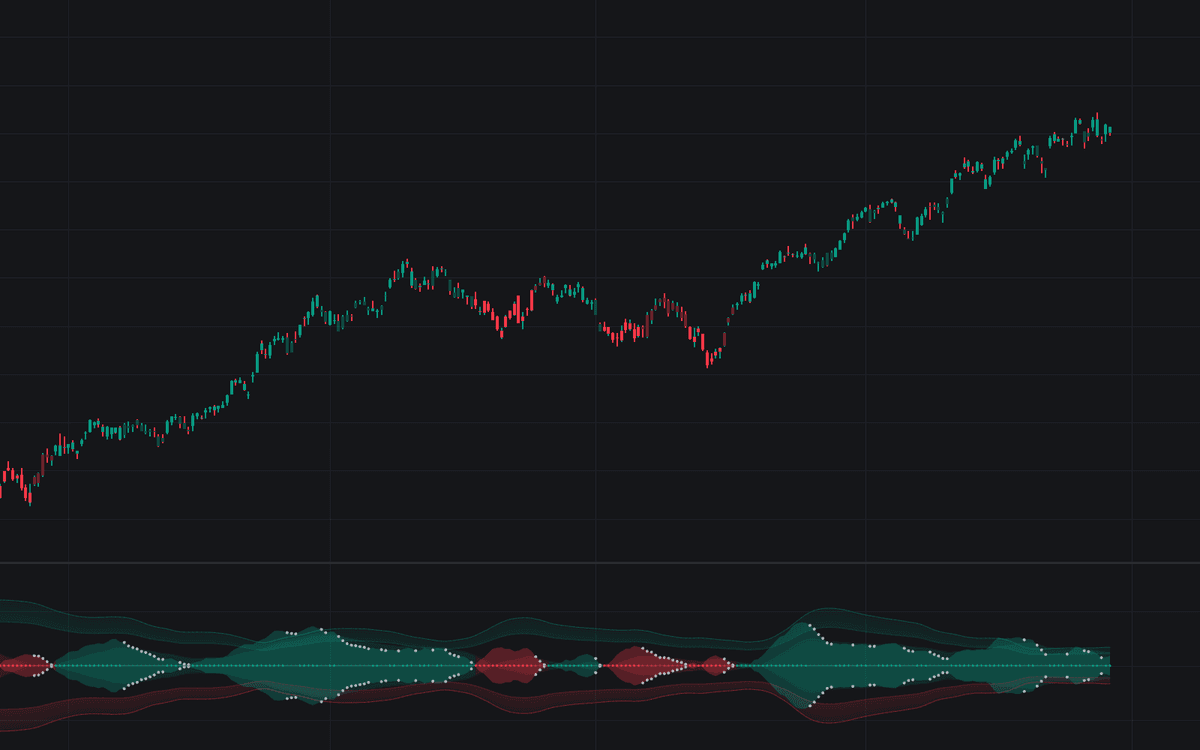
The Momentum Cycle Sentry is designed to provide a complete view of market flow by plotting a mirrored oscillator around a central zero line. This creates a symmetric cloud structure where the width of the cloud represents the strength and velocity of the move.

When momentum accelerates, the cloud expands. When participation fades or a pullback begins, the cloud contracts.

This structure allows traders to:

  • Identify strong trend expansion phases
  • Recognize early retracement cycles
  • Spot overextended conditions
  • Track the exact path of pullbacks
  • Align entries with momentum resumption

Unlike traditional oscillators that rely on static thresholds, this trading strategy tool adapts dynamically to volatility and trend structure.

Identifying Bullish and Bearish Trends

The Momentum Cycle Sentry clearly distinguishes directional bias using color and symmetry.

  • Bullish Momentum: The oscillator cloud appears above and below the zero line in a teal (bullish) structure.
  • Bearish Momentum: The oscillator cloud shifts into coral (bearish) tones.
  • Cloud Width:
    • Expanding width = increasing trend velocity
    • Contracting width = weakening momentum or compression

This symmetric structure ensures that traders visually perceive momentum intensity equally in both bullish and bearish conditions. It effectively transforms abstract momentum data into a measurable "volume of force" around price.

In strong trends, you’ll observe sustained expansion. In consolidation or pre-breakout compression, the cloud narrows significantly.

Momentum Cycle Tracing with Neon Path Logic

One of the most distinctive features of this momentum trading indicator is its Neon Path retracement detection system.

When momentum cools off against the prevailing trend:

  • The cloud and candles dim, signaling a temporary resting phase.
  • A Triple-Layer Glow activates directly on the oscillator curve.
  • The glow intensifies using graduated transparency, producing a neon-like retracement trail.
  • Cross (X) markers appear on the zero line to anchor the retracement duration.

This allows traders to visually track the pullback’s path toward equilibrium.

How Traders Use This

  • Wait for a retracement glow to approach the zero line.
  • Monitor for momentum curvature or re-expansion.
  • Use resumption signals to align with the primary trend.

This transforms pullbacks from random noise into clearly structured cycles within a broader momentum trend.

Trading Extreme Zones (Overbought & Oversold)

The Momentum Cycle Sentry includes adaptive Overbought (OB) and Oversold (OS) corridors based on standard deviation rather than fixed levels like 70/30.

When the oscillator enters these dynamic gradient zones:

  • The market is statistically stretched relative to recent volatility.
  • The probability of exhaustion or mean reversion increases.
  • Traders can watch for curvature back toward the zero line.

Because these zones adapt to volatility, they remain relevant across:

  • Forex markets
  • Cryptocurrency markets
  • Stocks and ETFs
  • Futures contracts

This makes the indicator highly flexible across timeframes and asset classes.

Indicator Architecture and Technical Details

Multi-Layered EMA Momentum Structure

The core of this trading indicator is built on five layers of Exponential Moving Average (EMA) smoothing applied to a base momentum calculation.

This creates:

  • A responsive inner core (reacts quickly to price shifts)
  • Progressive outer layers (define broader structural trend)
  • A visual “glow” effect that reflects layered momentum strength

The symmetric mirroring ensures that directional bias does not distort perception. Traders see momentum magnitude clearly, whether the market is trending up or down.

This layered approach reduces noise while preserving responsiveness, making it suitable for both scalpers and swing traders.

Dynamic Volatility Corridors

Instead of fixed oscillator thresholds, this tool uses standard deviation-based bands.

This means:

  • OB/OS levels expand during volatile markets
  • OB/OS levels contract during calm markets
  • Signals remain statistically relevant

This adaptive behavior prevents false overbought/oversold readings during strong trends — a common issue in traditional oscillators.

Settings and Customization

The Momentum Cycle Sentry provides extensive flexibility for different trading strategies.

Core Settings

  • Base Length: Defines the lookback period for the underlying momentum engine.
  • Smoothing: Controls EMA smoothing intensity across the layered architecture.
  • Magnitude: Scales oscillator height for better chart visibility.
  • Retracement Sensitivity: Adjusts how aggressively the script detects cooling cycles.

Shorter lengths = faster signals.
Longer lengths = smoother macro trend cycles.

Extreme Zone Settings

  • OB/OS Lookback: Determines volatility calculation window.
  • Inner Multiplier: Sets the initial overextension boundary.
  • Outer Multiplier: Defines historical extreme levels.

Traders can tighten these for mean reversion systems or widen them for trend-following strategies.

Visual Customization

  • Bullish/Bearish Colors: Fully customizable trend coloring.
  • Base Transparency: Controls layered cloud opacity.
  • Color Candles: Syncs chart candles with oscillator state for full visual integration.

Who Should Use This Trading Indicator?

The Momentum Cycle Sentry is ideal for:

  • Trend-following traders
  • Pullback entry traders
  • Volatility-based traders
  • Momentum breakout strategies
  • Multi-timeframe analysts

Because it combines trend detection, retracement visualization, and adaptive volatility measurement, it can serve as a standalone momentum trading strategy or as a confirmation layer within a broader system.

Frequently Asked Questions (FAQ)

What makes the Momentum Cycle Sentry different from a traditional oscillator?

Unlike fixed-level oscillators, it uses a symmetric multi-layer EMA structure and dynamic volatility corridors. It visually maps the full lifecycle of a trend, including expansion, retracement, and exhaustion.

Can it be used on all markets?

Yes. It works across stocks, crypto, forex, and futures markets and adapts to different volatility environments automatically.

Is this a trend-following or mean-reversion indicator?

It can be used for both. Traders can follow expanding cloud trends or trade exhaustion signals when the oscillator reaches extreme volatility corridors.

How do I access the Momentum Cycle Sentry?

You can get access on the LuxAlgo Library for charting platforms like TradingView, MetaTrader (MT4/MT5), and NinjaTrader for free.

Free indicator

Get free access to this indicator on the platforms below.

TradingView
NinjaTrader
MetaTrader 4/5

Unlock the entire LuxAlgo Library

Every indicator, every strategy, full charts, and complete access to Quant — our AI agent.