Market Structure Volume Distribution
 By LuxAlgoApr 9, 2024
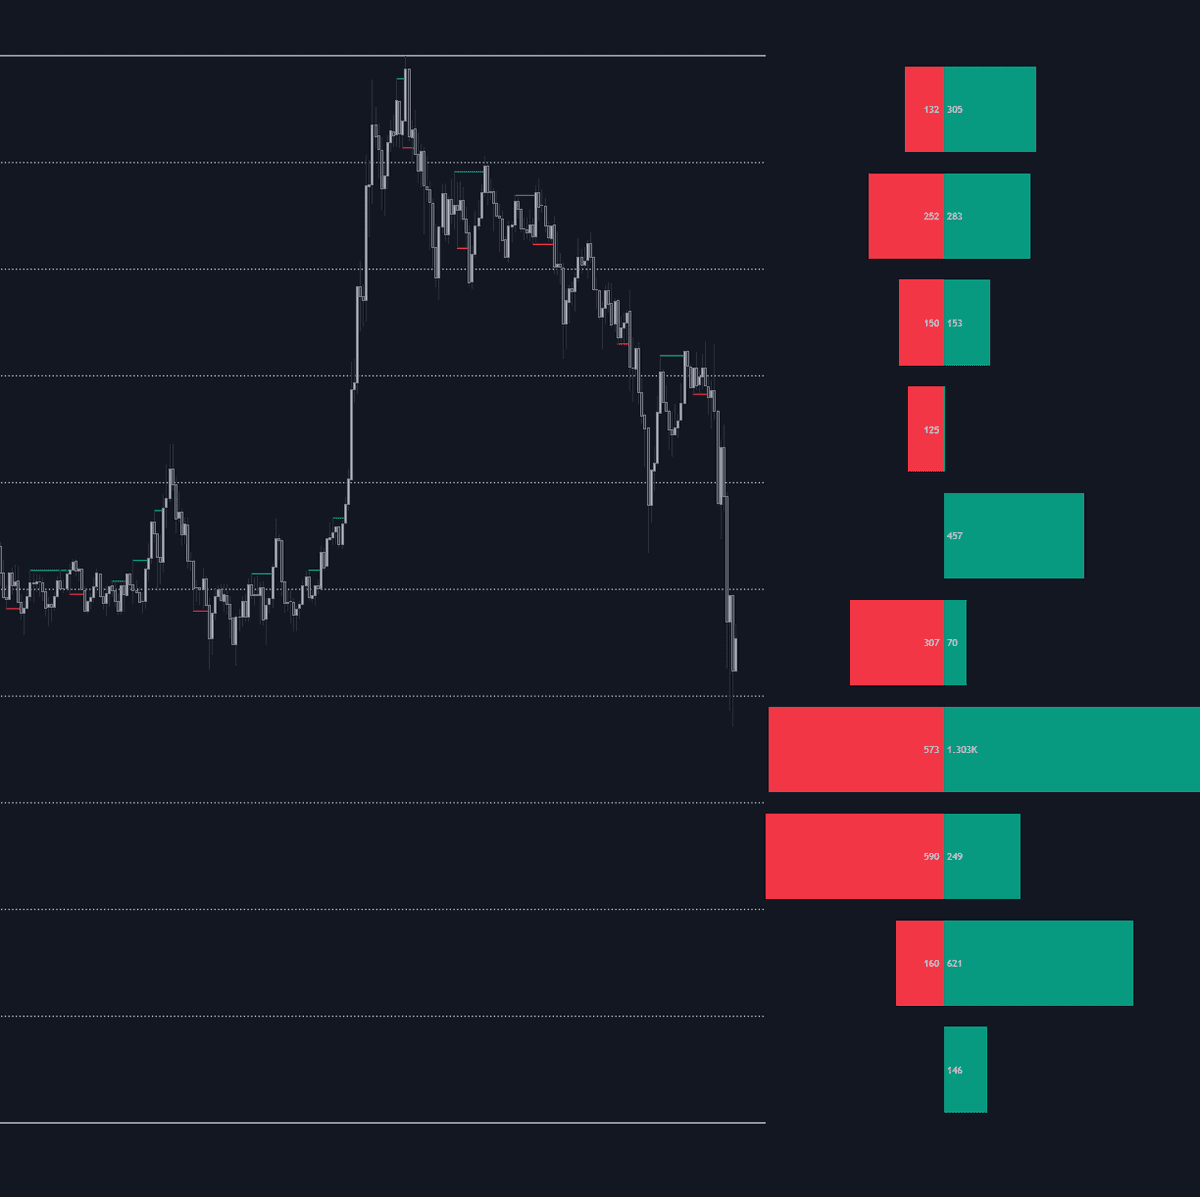
The Market Structure Volume Distribution answers the question structure tools usually leave open: how much force stood behind the break? It pairs swing-based market structure detection with a volume profile and a grid — structure lines confirm in green for bullish breaks and red for bearish, while the profile aggregates buy and sell volume row by row across the execution window.
How to Trade the Market Structure Volume Distribution?
- Weigh breaks by participation: match each structure line to its grid row on the profile — a break through a heavily traded row carries more conviction than one through thin trade.
- Grid rows as levels: the equally sized rows partition the analyzed range and serve as automatic support and resistance.
- Buy vs sell split: in the default BUY&SELL VOLUME mode each row separates buying from selling, showing which side supplied the liquidity around structure events.
- Tune the horizon: a short swing-point period surfaces short-term structure; longer periods isolate the breaks swing traders care about.
Market Structure Volume Distribution Settings
- Execute on all visible range (default false): calculate from every visible bar, overriding the fixed window.
- Execute on the last N bars (default 500): the calculation window when visible-range mode is off; accepts 20–5000.
- Pivot Length (default 2): bars needed to confirm a pivot — larger values detect fewer, more significant breaks.
- Profile Rows (default 10) / Profile Width (default 200): resolution and maximum width of the profile.
- Profile Mode (default BUY&SELL VOLUME): combined totals or a buy/sell split; colors and dotted grid display are adjustable.
Frequently Asked Questions
What does the grid actually add?
It divides the execution window's price range into equal rows, so every structure event maps visually to its row in the profile. The row boundaries themselves behave as ready-made support and resistance references.
How does this differ from a swing-anchored profile?
Swing Volume Profiles anchors its distributions to individual swings, while this tool keeps one distribution across the whole window and layers structure lines and the grid on top — built for the structure-versus-volume comparison.
Is the Market Structure Volume Distribution free?
Yes — access is free via the LuxAlgo Library. The page also lets you send the tool directly to Quant, LuxAlgo's AI, to explore how structure breaks and volume interact on your markets.
Free indicator
Get free access to this indicator on the platforms below.

The Library is free. Quant makes it yours.
Pull any concept or indicator into Quant: rebuild it, retune it, or turn it into a backtested strategy of your own.