Multi Ranges Volume Distribution
 By LuxAlgoJul 16, 2025
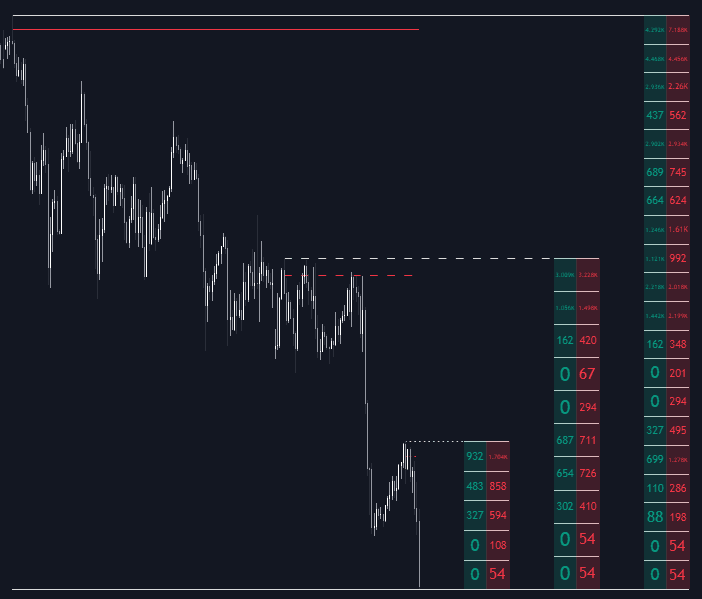
The Multi Ranges Volume Distribution trading indicator is a highly effective volume profile tool that enables traders to visualize how volume is distributed across price levels for up to three different timeframes simultaneously. This advanced multi-timeframe volume indicator helps traders assess both short-term and long-term areas of price interest by highlighting volume concentration zones such as the Point of Control (POC), high-volume nodes, and price extremes.
Designed for traders seeking deeper market insight, this indicator lets you analyze either total volume or split buy/sell volume at each price level, allowing for greater understanding of market sentiment and order flow dynamics. Whether you're scalping, day trading, or swing trading, this tool provides a clear window into volume-based price action across any timeframe you choose.
How to Trade with the Multi Ranges Volume Distribution Indicator?
By default, this tool displays three volume profiles corresponding to daily, weekly, and monthly timeframes. Each distribution calculates and displays:
- The top price and bottom price of the range
- The POC (Point of Control) – the price with the highest traded volume
- Accumulated volume within each row (price level)
This setup allows traders to spot the most active price levels across different timeframes, helping them pinpoint key support/resistance zones, potential breakout levels, and areas of high institutional interest.
The indicator is perfect for multi-timeframe volume analysis, allowing a trader to compare how volume behaves across overlapping ranges, giving deeper insights into whether price action is being driven by short-term speculators or long-term investors.
Customize Timeframes and Volume Row Granularity
One of the core strengths of the Multi Ranges Volume Distribution tool is its flexibility. Each of the three volume profiles (Period A, B, and C) can be customized independently by:
- Choosing any chart timeframe (e.g., daily, weekly, monthly, etc.)
- Setting the number of volume rows (price levels)
The more rows you set, the more granular and detailed your volume analysis becomes. This can help you zoom into tighter price zones or zoom out to evaluate larger trend context.
In the chart above, three profiles are shown using the same monthly timeframe but with increasing row counts—each profile providing more detailed structure of how volume is stacked across the price ladder.
Visualizing Total Volume vs Buy/Sell Volume Split
A powerful feature of this indicator is the ability to choose between displaying total volume or separated buy and sell volume at each price level.
When using the Buy/Sell Volume view:
- Each row is color-graded based on the volume delta (difference between buy and sell volume)
- Traders can instantly spot whether a specific price range is being absorbed by buyers or sellers
- Helps confirm potential reversal zones or breakout pressures by seeing which side is more aggressive
This makes it a fantastic tool not only for trend-following strategies but also for contrarian volume-based setups.
Indicator Settings and Customization
- Volume Display: Toggle between total volume or split buy/sell volume visualization
- Distance Between Each Box: Adjust how spaced out the profiles are on the chart for clarity
- Period A / B / C: Set the timeframe and number of volume rows for each of the three ranges independently
This flexibility gives you full control over how you want to interpret the market, from macro-level zones to microstructure precision.
FAQ
What makes the Multi Ranges Volume Distribution indicator unique?
Unlike typical volume profile tools that only show one timeframe, this indicator displays up to three customizable volume profiles simultaneously, giving multi-timeframe insight for superior decision-making.
Can I use this with any asset or market?
Yes, this volume profile tool is compatible with any asset class available on your charting platform, including stocks, forex, crypto, and commodities.
Is this suitable for beginner traders?
Absolutely. While volume profile tools are often associated with advanced trading, the Multi Ranges Volume Distribution indicator has an intuitive interface and clear visual layout, making it accessible for all experience levels.
How can I access the Multi Ranges Volume Distribution indicator?
You can get access on the LuxAlgo Library for charting platforms like TradingView, MetaTrader (MT4/MT5), and NinjaTrader for free.
Free indicator
Get free access to this indicator on the platforms below.

Unlock the entire LuxAlgo Library
Every indicator, every strategy, full charts, and complete access to Quant — our AI agent.