Savitzky-Golay Filter
 By LuxAlgoOct 9, 2026
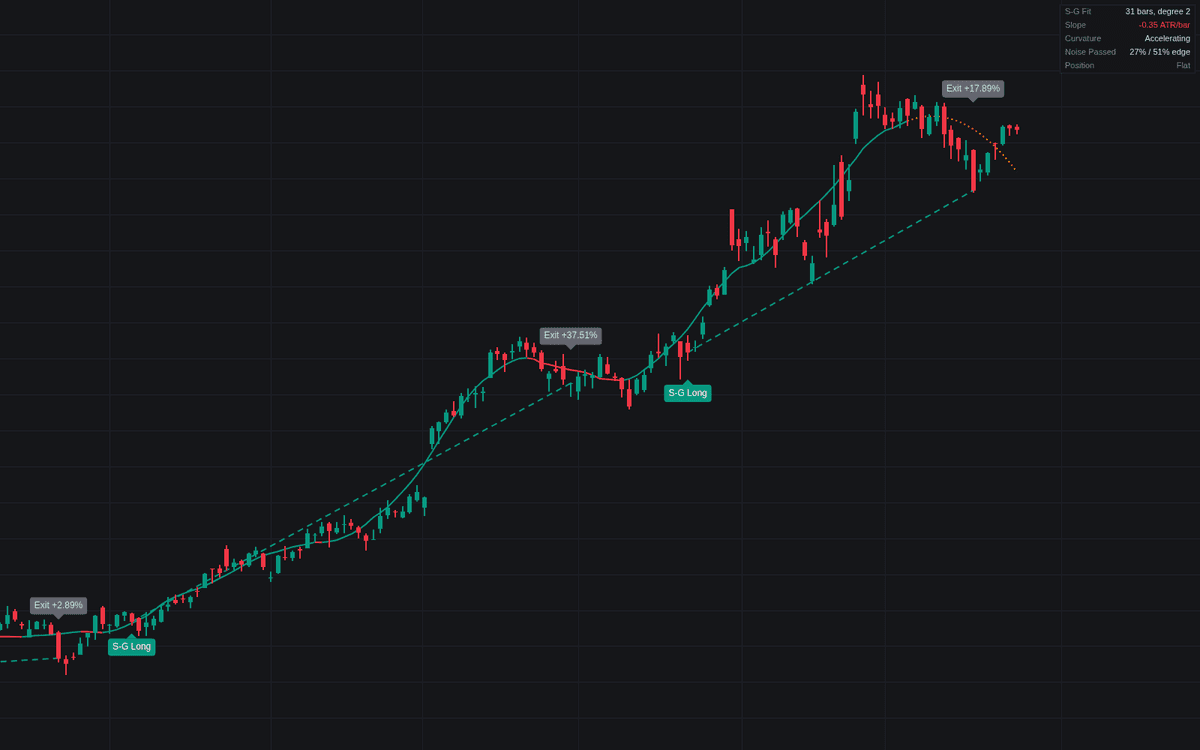

The Savitzky-Golay Filter is a sophisticated signal processing tool that performs a least-squares polynomial fit over a defined window of data to smooth price action while preserving the essential shape of peaks and troughs. Unlike traditional moving averages that inherently introduce significant lag and flatten out critical price turning points, the Savitzky-Golay approach effectively balances noise reduction with trend fidelity. By calculating the derivative of the fitted polynomial, traders can identify shifts in momentum and local price trends with improved accuracy, providing a distinct analytical advantage in both trending and ranging market environments.
How to Trade the Savitzky-Golay Filter?
Trading with the Savitzky-Golay Filter primarily involves monitoring the slope of the real-time polynomial fit. A positive slope indicates a bullish trend, while a negative slope suggests bearish momentum. Traders often look for a slope reversal to signal potential entry or exit points.
To filter out insignificant price fluctuations, use the Minimum Slope setting, which requires the fitted slope to exceed a specific threshold of the Average True Range (ATR) before a signal is triggered. This helps avoid "whipsaw" entries during low volatility or sideways consolidation. When the signal is active, the indicator identifies the trend direction, allowing you to enter long positions when the slope turns positive and short positions when it turns negative. The provisional edge, shown as a dotted line, provides an early look at the trajectory of the newest data points, allowing for proactive analysis before the filter is finalized.
Savitzky-Golay Filter Settings
Savitzky-Golay Fit
- Source: The data series used for the polynomial calculation.
- Half Width (m): Determines the window size as 2m + 1 bars. Larger values increase smoothing but may introduce more latency.
- Polynomial Degree: The degree of the fitted polynomial. Higher degrees follow price curves more closely but may include more market noise.
- History (bars): The total look-back period for drawing the confirmed filter.
- Show Provisional Edge: Enables the display of the current, non-finalized polynomial fit for the most recent bars.
- Mark Confirmed Peaks / Troughs: Places labels at significant turning points once they are verified by the look-back window.
Slope Turns
- Signals: Toggles signal generation for long, short, or both directions.
- Minimum Slope (ATR per bar): Sets the sensitivity of the slope turn detection. Increasing this value requires a stronger move to trigger a signal.
- Show Trades: Displays visual cues for entries and exits on the chart.
Style
- Line Width: Adjusts the thickness of the filter line.
- Rising/Falling: Color configuration for the filter trajectory.
- Provisional Edge/Neutral: Colors for the real-time, non-finalized portion of the indicator.
Dashboard
- Show Dashboard: Toggles the on-screen data panel.
- Position/Size: Adjusts the placement and scaling of the summary dashboard.
Frequently Asked Questions
Free on Vela
Run it on Vela. Go further with a paid plan.
- Up to 500 strategy alerts, with webhook automation
- Up to 10× the chart history of Free
- Orderflow lookback up to full history
- Up to 100,000 monthly credits for Quant to customize it
- Futures data alongside crypto, stocks, forex and commodities

Run it on Vela. Make it yours with Quant.
Open this indicator free on Vela, our next-generation charting platform. Then ask Quant, our coding agent built into Vela, to retune it or turn it into a backtested strategy of your own.