Ehlers Instantaneous Trendline
 By LuxAlgoApr 25, 2026
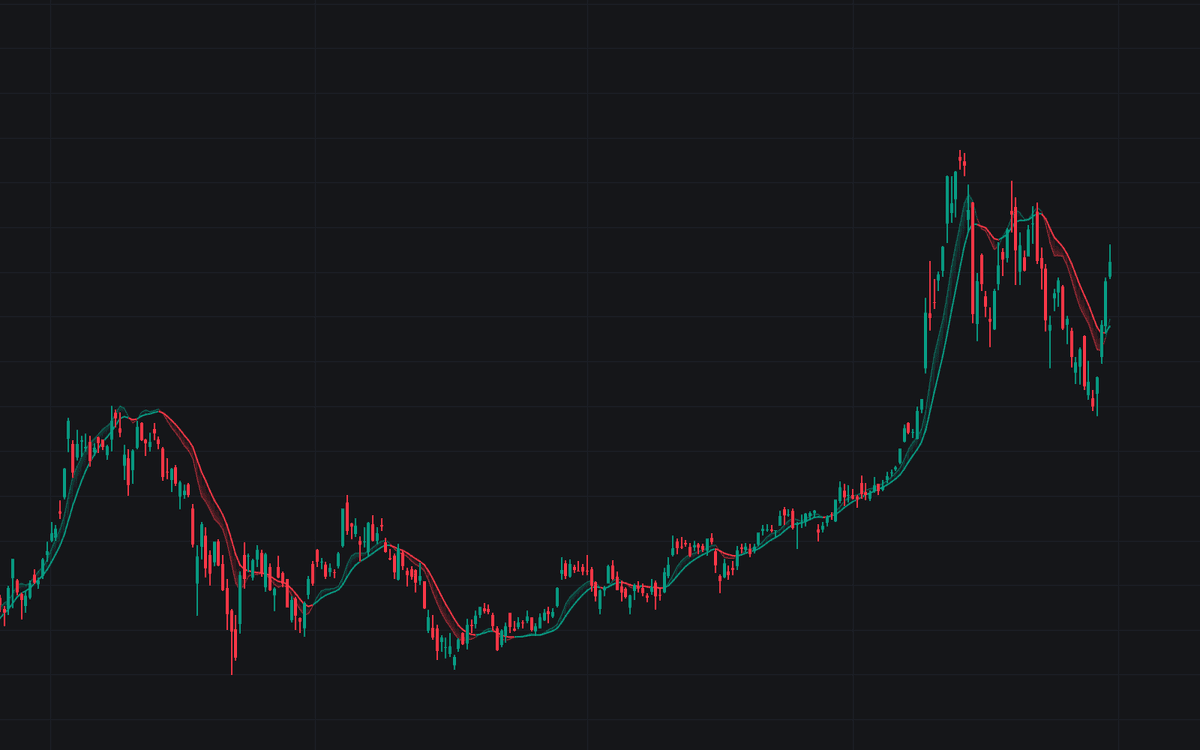

Ehlers Instantaneous Trendline plots the compact recursion John Ehlers published as the simplified form of his low-lag smoother, computed on the bar midpoint, together with its trigger, a lag-reduced projection: twice the current trendline value less the reading from two bars earlier. The pair keeps the promise of the original Instantaneous Trendline: trend following with far less delay than a comparable fixed average. Both lines and the fill between them hold the bullish color while the trigger sits above the trendline, and the bearish color below.
How to Trade the Ehlers Instantaneous Trendline?
- Trigger above the trendline: long bias; trigger below: short bias, the conventional read of the pair.
- Trigger crossings: the classic entry and exit events, covered by alerts and optional circle markers.
- Slope reversals: the trendline turning up or down is the slower, moving-average-style bias read, with its own pair of alerts.
- Fill width: a wide, glowing fill marks trending separation; a tight braided pair warns that crossings are churn.
Because the recursion needs history, the first bars of a chart use Ehlers' FIR warm-up average: the trendline appears a few bars in, the trigger two bars after that.
Ehlers Instantaneous Trendline Settings
- Source (default hl2): the price series the trendline is computed on; the published construction uses the bar midpoint.
- Alpha (default 0.07): the smoothing coefficient, Ehlers' published default. Smaller is smoother and slower; larger hugs price more closely.
- Style toggles: Gradient Fill defaults on; Crossover Markers default off, with the crossover alerts firing regardless.
Frequently Asked Questions

The Library is free. Quant makes it yours.
Pull any concept or indicator into Quant: rebuild it, retune it, or turn it into a backtested strategy of your own.