Trend-quality Composites
 By LuxAlgoMay 13, 2026
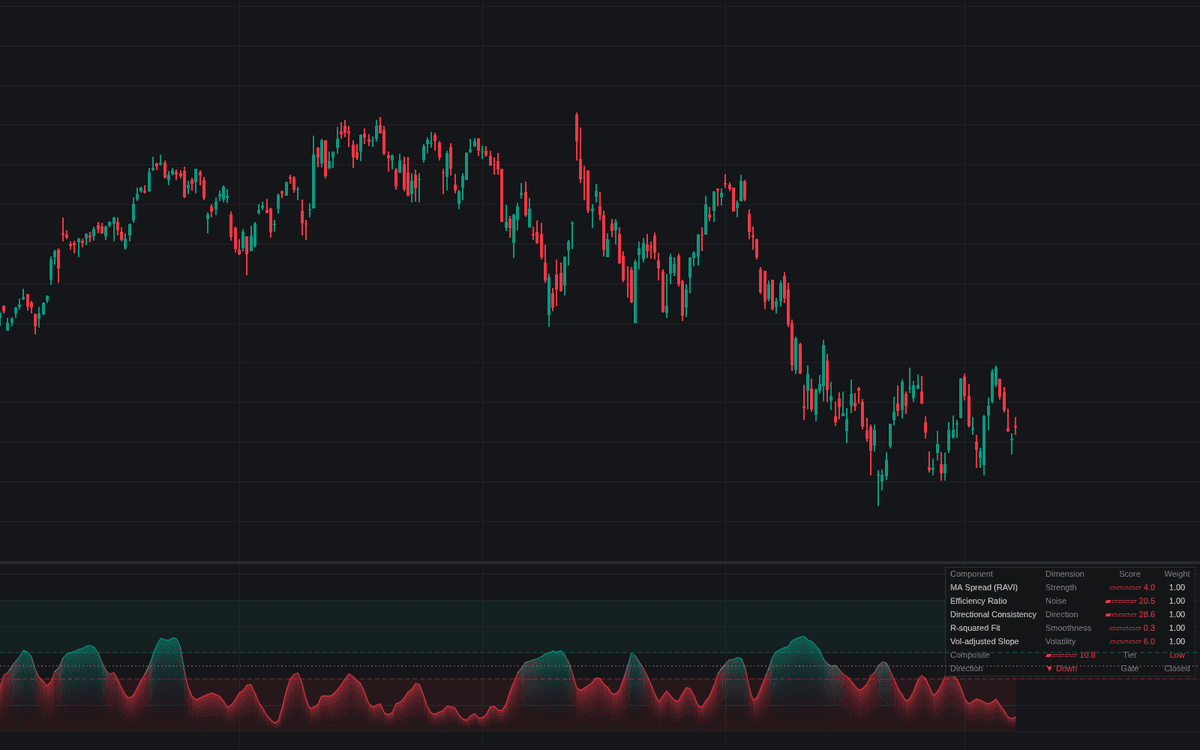

Trend-quality Composites condenses five readings of how cleanly price is trending into a single 0–100 score, a complete trend-quality composite in one pane. Chande's RAVI spread runs its own 7/65 average pair, while the Kaufman Efficiency Ratio, directional consistency of closes, R-squared fit and volatility-adjusted slope share one quality window; unbounded ingredients are percentile-ranked against their own history so the blend adapts to any symbol.
How to Trade the Trend-quality Composites?
- Score at or above the high threshold: high-quality trend. The trend-following gate is open, or use the score as a graded weight on size and confidence.
- Score at or below the low threshold: range conditions. Route signals to mean-reversion or stand aside.
- Between the thresholds: a transitional read; tier alerts fire on every entry into and exit from the outer tiers.
The dashboard lists each ingredient with its dimension (strength, noise, direction, smoothness, volatility), score bar and weight, then sums up the composite, tier, direction and gate state.
Trend-quality Composites Settings
- Source (default close): series the ingredients are measured on.
- Quality Window (default 14): shared lookback of the four price-action ingredients.
- Normalization Window (default 100): history used to percentile-rank the RAVI spread and volatility-adjusted slope.
- Score Smoothing (default 3): EMA on the blend so the tier read does not flicker; 1 shows the raw composite.
- MA Spread (RAVI), Efficiency Ratio, Directional Consistency, R-squared Fit and Vol-adjusted Slope: each on by default at weight 1, with RAVI Fast/Slow defaulting to 7 and 65.
- High Quality Threshold (default 60) and Low Quality Threshold (default 40): the tier boundaries.
- Style and dashboard toggles cover the directional tint, gradient fill, tier background and panel placement.
Frequently Asked Questions

The Library is free. Quant makes it yours.
Pull any concept or indicator into Quant: rebuild it, retune it, or turn it into a backtested strategy of your own.