Volume Oscillator
 By LuxAlgoApr 13, 2020
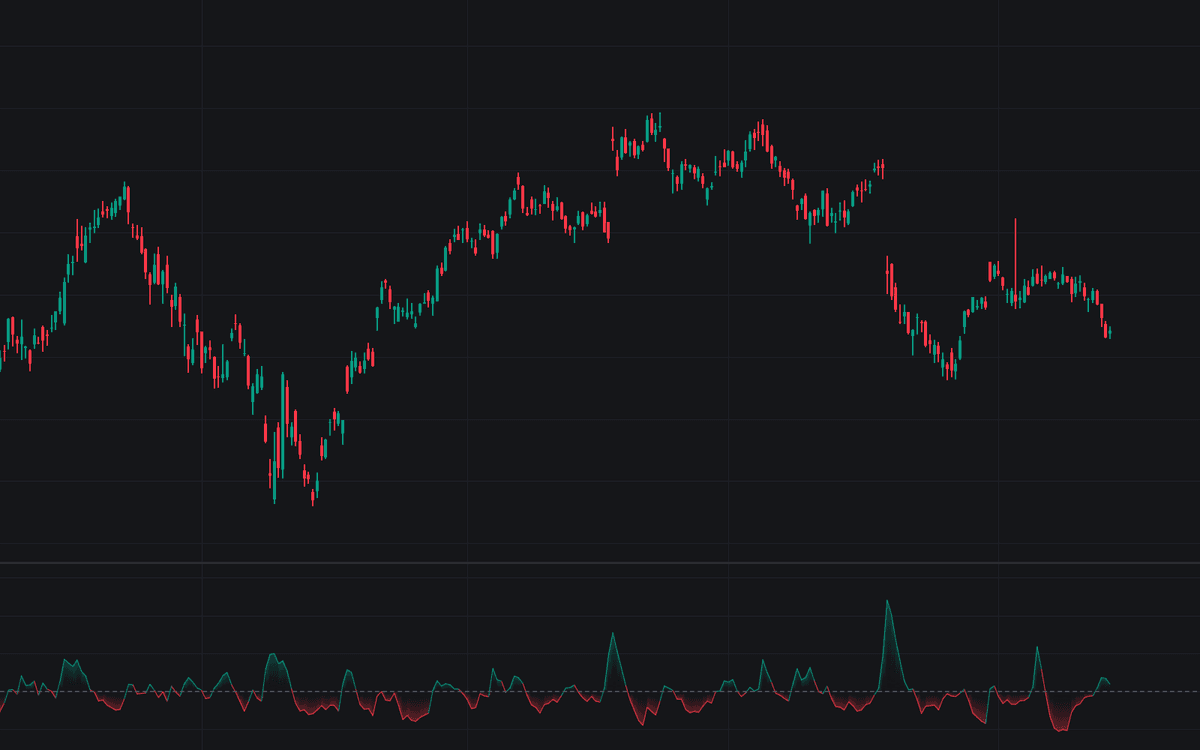

The Volume Oscillator measures the difference between a fast and a slow moving average of volume, expressed as a percentage of the slow average, to show whether trading activity is expanding or contracting. Above zero, recent volume runs ahead of its longer-term baseline; below zero, participation is drying up. This is the standard raw form of the volume oscillator: a 5-period EMA of volume measured against a 10-period EMA, plotted as a single line around a dashed zero line.
How to Trade the Volume Oscillator?
- Oscillator above zero: activity running above its recent baseline. Moves in either direction carry participation, and range breaks are better supported.
- Oscillator below zero: activity below baseline. Pullbacks on negative readings tend to read corrective, while breakouts attempted on them deserve suspicion.
- Rising slope: participation building into a developing move, often a more useful read than the sign itself.
- Zero crosses: the moment expansion turns to contraction or back, an activity regime marker, not a price signal.
The oscillator carries no directional information of its own: an aggressive sell-off expands it exactly as a strong rally does, so every reading needs the price event it accompanies.
Volume Oscillator Settings
- Fast Length (default 5): the fast EMA of volume; shortening it makes the oscillator snap to single sessions, and a climactic print inflates the fast average for days.
- Slow Length (default 10): the slow EMA serving as the baseline; lengthening steadies the comparison so expansions register longer, shortening lets the baseline chase activity and mutes readings.
Alerts
Two alert conditions: Zero Cross Up when the oscillator turns positive, Zero Cross Down when it turns negative.
Frequently Asked Questions

The Library is free. Quant makes it yours.
Pull any concept or indicator into Quant: rebuild it, retune it, or turn it into a backtested strategy of your own.