Volume Dry-up
 By LuxAlgoJun 8, 2026
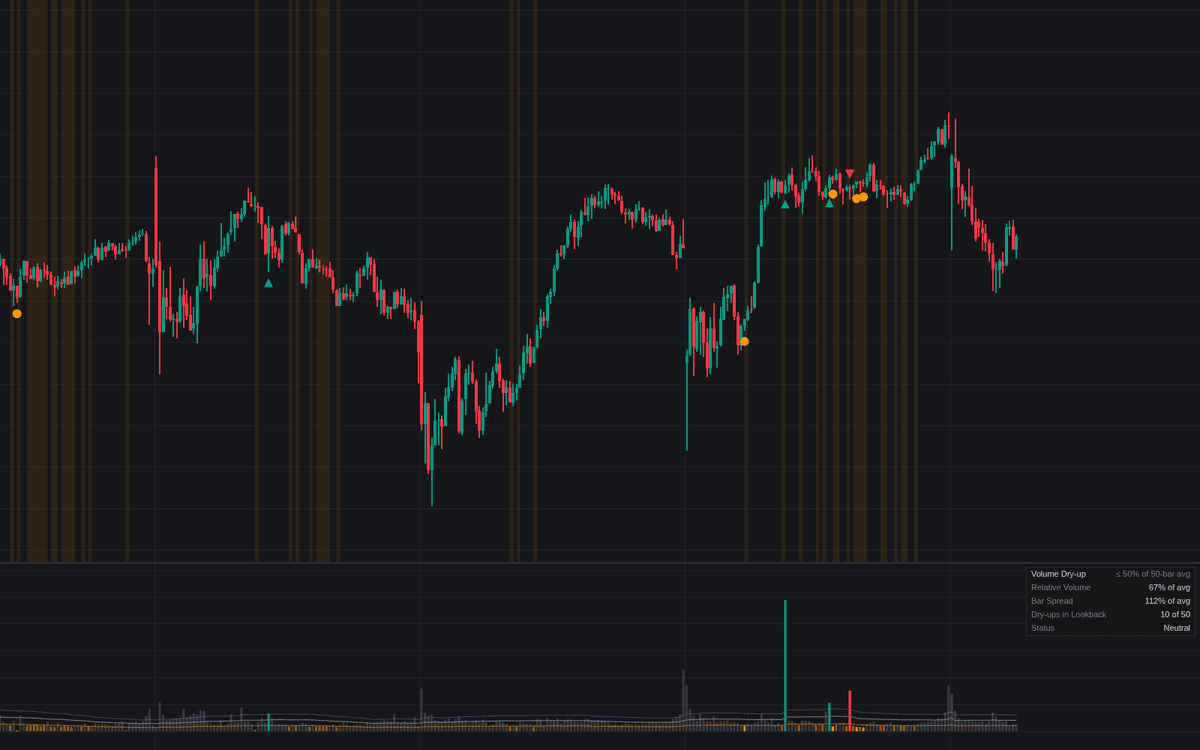

Volume Dry-up finds sessions where turnover quietly disappears (the volume dry-up growth-stock methods read as supply exhaustion), then watches for the expansion that answers it. A confirmed session qualifies when volume prints at or below half its 50-bar average, optionally with a contracting high-low spread; the lightest print of the lookback earns the extreme dry-up (VDU) tag. Qualified sessions color the columns, tint the price chart, and arm a resolution window: decisive expansion within 5 bars is graded bullish or bearish.
How to Trade the Volume Dry-up?
- Dry-up columns: dormancy, not a signal. Read the tinted bars against the price structure they sit in.
- VDU dot: the quietest trade of the entire lookback, the extreme read late in a base.
- Bullish Expansion triangle: an up close on at least 1.5x average volume inside the window, the constructive resolution.
- Bearish Break triangle: heavy volume on a down close. Supply answered the test; the constructive read is invalidated.
All four events carry alerts; the dashboard tracks relative volume, bar spread, the dry-up count, and the sequence state.
Volume Dry-up Settings
- Volume Baseline (default 50): bars in the volume and spread averages that stand in for normal.
- Dry-up Threshold (default 0.5): baseline fraction at or below which a session qualifies.
- Base Lookback (default 50): window for the VDU tag, pivot filter, and dry-up count.
- Range Contraction (default enabled, fraction 1): the bar's spread must sit at or below that fraction of its average.
- Pivot Proximity Filter (default disabled, distance 5): only qualify quiet sessions closing within 5% of the lookback high.
- Expansion Multiple (default 1.5), Resolution Window (default 5): what counts as decisive expansion and how long the link stays live.
- Dashboard and style toggles cover the panel, chart markers, and the dry-up tint.
Frequently Asked Questions

The Library is free. Quant makes it yours.
Pull any concept or indicator into Quant: rebuild it, retune it, or turn it into a backtested strategy of your own.