All indicators

Volumetric Toolkit

By LuxAlgoSep 28, 2023

Static chart image
Price Action BasedVolume BasedDivergencesLiquidityPivot Based (Retrospective)

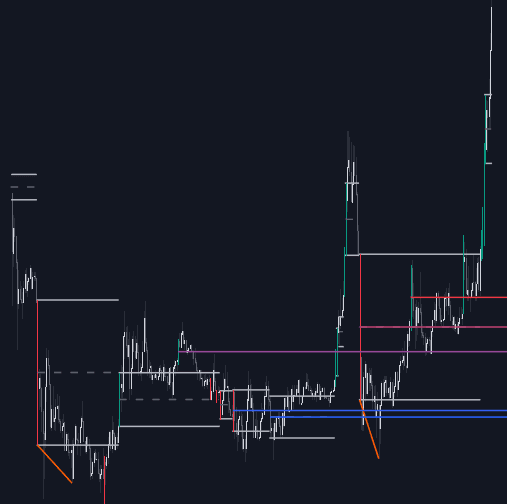
The Volumetric Toolkit is an advanced suite of trading indicators meticulously designed to derive critical price action analysis from volume data. Comprising four distinct features, this toolkit emphasizes understanding how volume correlates with market dynamics to assist traders in making informed decisions. Keep in mind that the toolkit necessitates volume data, so symbols lacking such data won't be compatible.

How to Use the Volumetric Toolkit for Trading Success?

indicator image

At the heart of the Volumetric Toolkit lies the focus on price action, delineating crucial market aspects like support and resistance levels, trading ranges, and volume divergences. Each feature is based on the foundational concept that volume reflects market participants' interest in a given asset, and this interest varies over time.

Here’s a deeper dive into each of the toolkit’s features:

Understanding Ranges Of Interest in Trading

indicator image

The Ranges Of Interest is a pivotal feature that identifies trading ranges marked by high liquidity surges. These ranges consist of the price high and low of a candlestick with associated significant liquidity.

indicator image

Traders can utilize these extremities as potential support and resistance levels. Breakouts from these ranges, often accompanied by substantial liquidity, may signal potential trend continuations. Adjusting the length setting controls the sensitivity of range detection to volume changes, requiring higher volume to identify new ranges.

Utilizing Impulses in Your Trading Strategy

indicator image

Impulses highlight scenarios where volume reaches a new high while the price also makes a new higher high or lower low, indicating heightened market engagement.

A bullish impulse occurs when the price makes a new higher high, depicted in green, whereas a bearish impulse occurs with a new lower low, shown in red.

indicator image

When impulses emerge against an established trend (e.g., a bearish impulse in an uptrend), they might suggest potential trend reversals. Length settings are similar to Ranges of Interest, with higher values marking significant impulses, pointing to possible long-term reversals.

Leveraging Levels Of Interest for Trade Decisions

indicator image

Levels Of Interest feature brings attention to price levels with notable trading activity. Unlike ranges, only closing prices are assessed, and volume peaks signal significant trading events. Note, this feature is prone to retrospective adjustments (backpainting).

indicator image

Traders can set how many of the latest levels appear on the chart, serving classic support and resistance roles.

Mastering Volume Divergence Insight

indicator image

Volume divergence arises when market participation decreases even as a trend progresses, characterized by volume making a lower high while price achieves a new higher high or lower low.

indicator image

This signals a potential diminishing interest in the trend, hinting at possible reversals. High length values will illustrate long-term divergences. Like Levels of Interest, this feature also may undergo backpainting.

Customizing Settings for Optimal Usage

Ranges Of Interest

  • Show Ranges Of Interest: Choose to display Ranges Of Interest.
  • Length: Adjust sensitivity to volume changes affecting Ranges Of Interest.

Impulses

  • Show Impulses: Opt to display Impulses within your analysis.
  • Length: Modify sensitivity to volume for Impulses.

Levels Of Interest

  • Show: Decide on the display of Levels Of Interest and how many recent ones to include.
  • Length: Set how sensitive Level detection is to volume occurrences.

Volume Divergences

  • Show Divergences: Select to showcase Volume Divergences.
  • Length: Specify the period for recognizing price tops/bottoms and volume peaks.

FAQ

What is the Volumetric Toolkit?

The Volumetric Toolkit is a comprehensive suite designed for enhancing trading strategies by analyzing price actions through volume data. It includes features like Ranges Of Interest, Impulses, Levels Of Interest, and Volume Divergences.

How can the Volumetric Toolkit improve my trading strategy?

By providing insights into market dynamics, such as potential support and resistance levels and trend reversals, it allows for more informed trading decisions based on volume analysis.

How to access the Volumetric Toolkit?

You can get access on the LuxAlgo Library for charting platforms like TradingView, MetaTrader (MT4/MT5), and NinjaTrader for free.

Free indicator

Get free access to this indicator on the platforms below.

TradingView
NinjaTrader
MetaTrader 4/5

Unlock the entire LuxAlgo Library

Every indicator, every strategy, full charts, and complete access to Quant — our AI agent.