5 Common Divergence Mistakes Traders Make
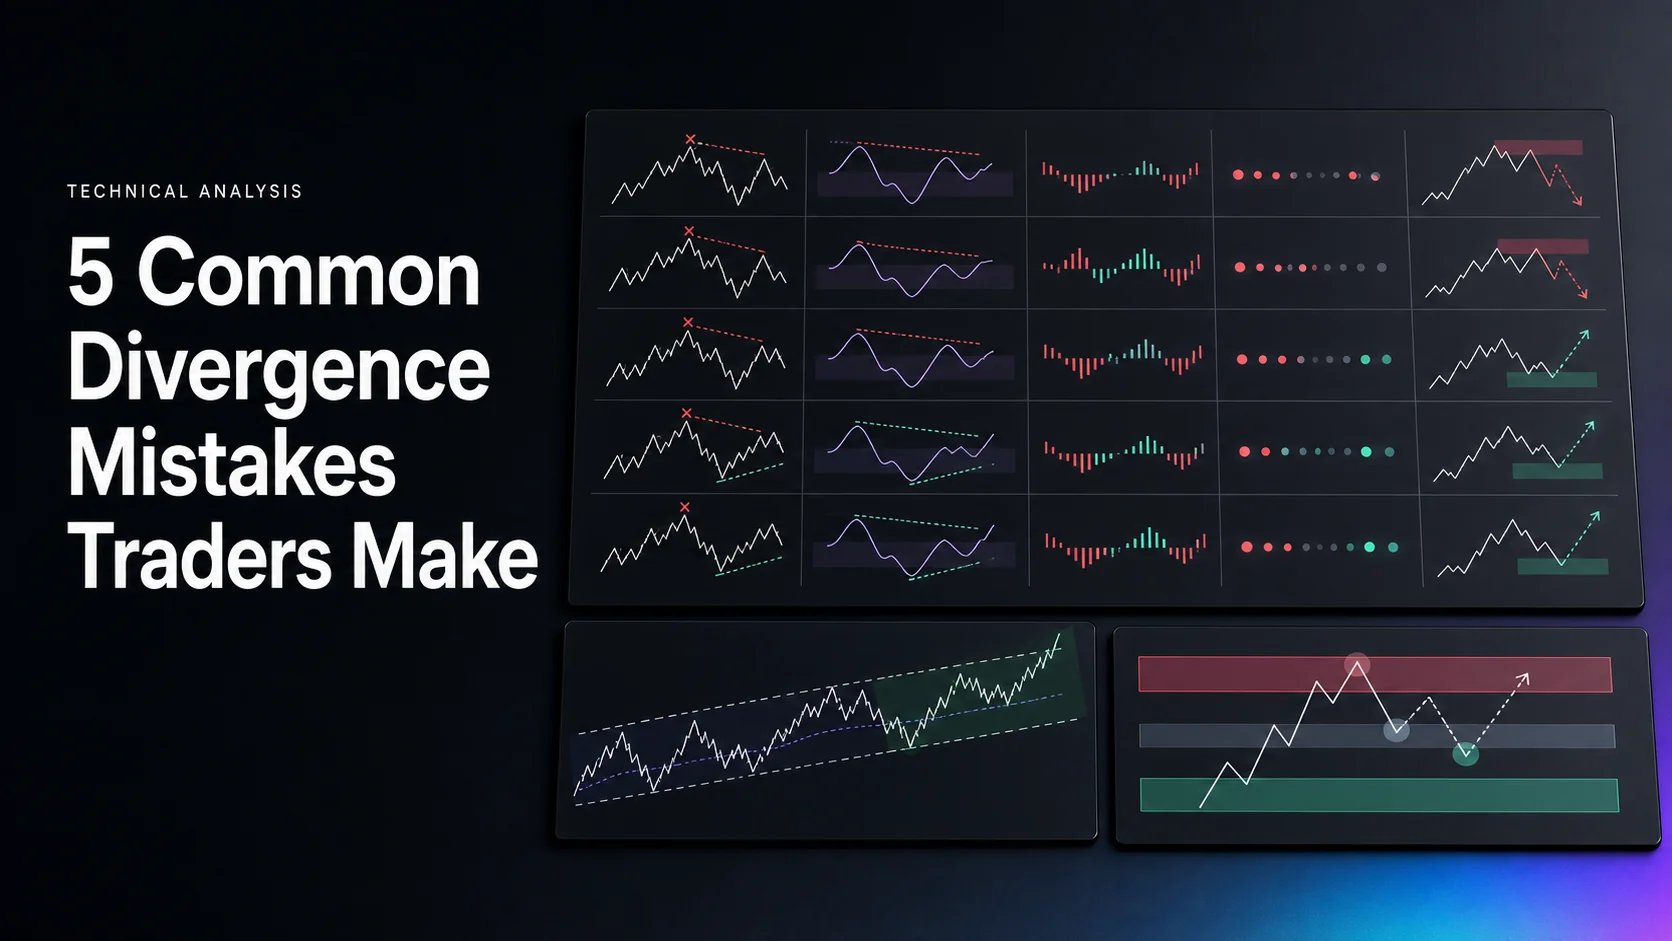
Divergence compares selected price swings with corresponding indicator observations. It can help frame a trading hypothesis, but it does not tell you that a reversal must happen. The most consequential mistakes are unclear comparisons, unavailable information, redundant filters, poorly defined risk and inconsistent selection rules.
This guide explains five mistakes and how to make each decision testable. Use native LuxAlgo charts to inspect the observations and Quant, our coding agent, to help express complete strategy rules. A drawing, alert or favorable example is not a verified trading result.
| Mistake | Problem | Practical correction |
|---|---|---|
| Misreading price and indicator | Comparing unrelated swings or different series | Define the points, indicator and detection time. |
| Ignoring timeframe context | Using unfinished higher-timeframe values as final | Specify each timeframe’s role and completed-bar timing. |
| Assuming more indicators prove the signal | Counting overlapping price calculations as independent evidence | Test what each additional condition contributes. |
| Weak risk control | Confusing planned risk with exposure or guaranteed loss | Calculate quantity from actual entry, stop and costs. |
| Trading undefined signals | Calling winners strong and losers weak afterward | Write selection, expiration and execution rules first. |
1. Comparing the Wrong Price and Indicator Points
Regular bullish divergence compares a lower price low with a higher oscillator observation. Regular bearish divergence compares a higher price high with a lower oscillator observation. Specify whether those indicator values are sampled on price-pivot bars or taken from independently detected oscillator pivots within a defined matching window. These are different algorithms.
| Type | Second price point | Corresponding oscillator point | Hypothesis |
|---|---|---|---|
| Regular bullish | Lower low | Higher low | Possible weakening of downward momentum. |
| Regular bearish | Higher high | Lower high | Possible weakening of upward momentum. |
| Hidden bullish | Higher low | Lower low | A separate bullish continuation study. |
| Hidden bearish | Lower high | Higher high | A separate bearish continuation study. |
For example, price lows of 100 and 96 paired with RSI observations of 25 and 32 meet a regular bullish comparison under a price-pivot sampling rule. Price highs of 110 and 114 paired with RSI values of 75 and 68 meet the bearish comparison. Neither example specifies an entry or proves a profitable outcome.
Choose the series precisely: MACD line divergence and MACD histogram divergence can disagree. Set indicator length, source and smoothing consistently. Define minimum and maximum pivot separation, treatment of tied prices and whether intervening swings cancel the candidate. A large visual angle on a resized oscillator pane is not a numerical signal-strength measure.
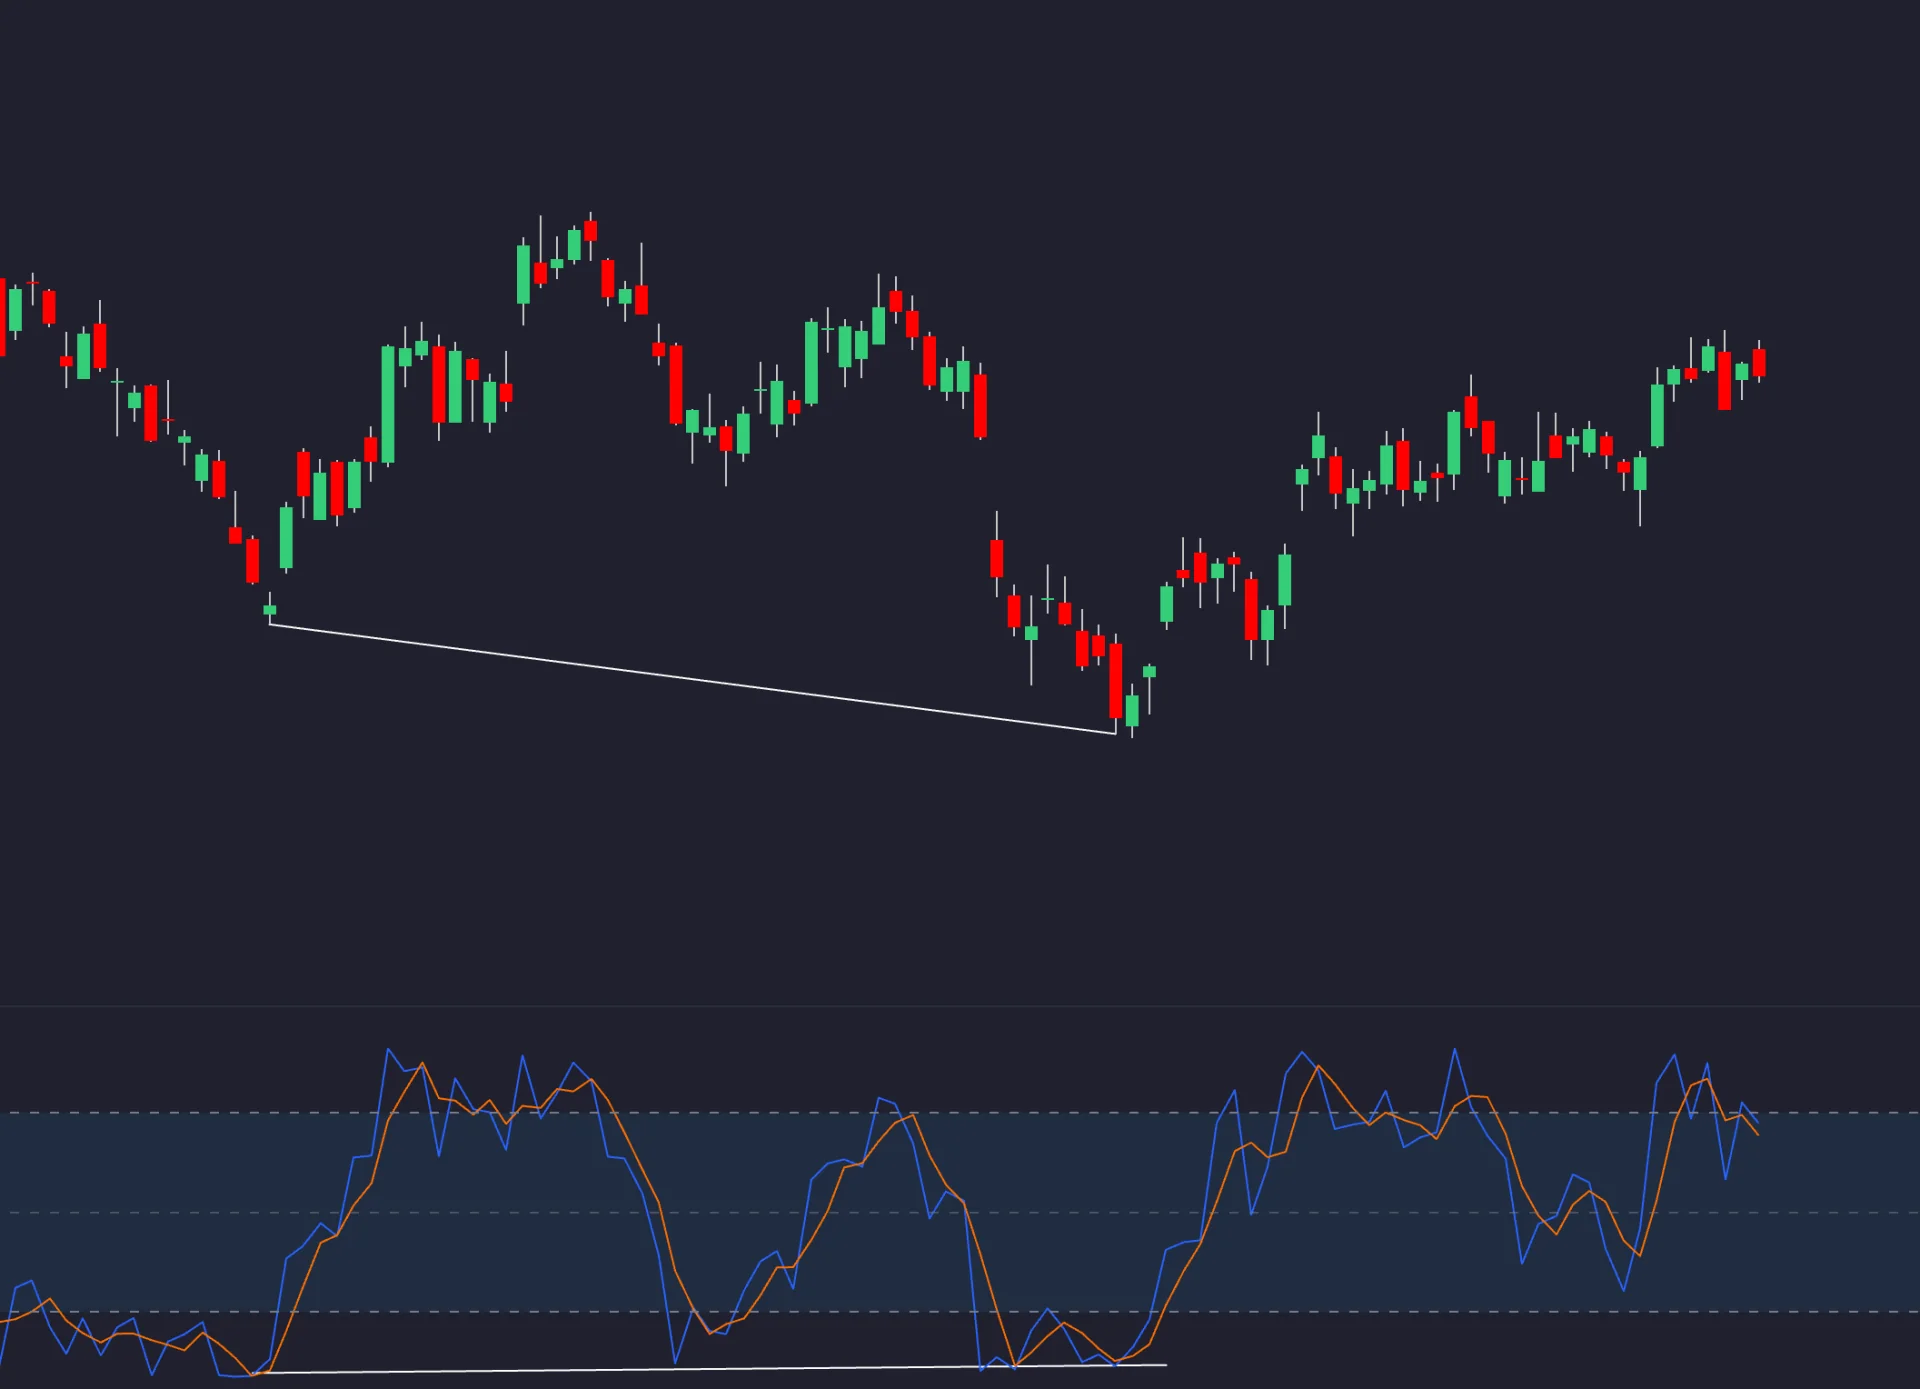
Small differences are not automatically invalid, and large differences are not automatically valuable. Use a stated threshold appropriate to the series and test it. MACD is expressed in price units, while RSI and Stochastic use bounded scales; their numerical differences are not interchangeable.
Distinguish the Pivot from Its Detection Time
A pivot requiring five later bars cannot be known at the turning point itself. A low on bar 100 becomes identifiable only after bar 105 under that rule. Plotting an annotation back to bar 100 must not create a trade there using later information. TradingView’s repainting documentation explains this retrospective display and why live, unfinished values can change.
Record the pivot time, detection time and any later entry trigger separately. Compare the historical display with the information that would have existed when the order was placed. A more visually complete chart after the fact is not evidence that all annotations were available in real time.
2. Using Timeframes without Defined Roles
A higher timeframe can provide context, but it does not automatically make a lower-timeframe signal better. A bullish divergence within a broader decline may be a countertrend hypothesis; a bearish divergence during an advance may precede further gains. Decide whether the strategy requires trend alignment or intentionally trades against it.
One possible plan uses a completed daily condition for context and a completed 15-minute price trigger for entry. A four-hour intermediate check is optional, not a mandatory third layer. Define the trend condition numerically rather than selecting whichever timeframe supports the trade.
At noon, the current daily candle has not necessarily closed. Its indicator value may differ from the final value. A historical test that applies the finished daily value to earlier intraday entries can use unavailable information. Keep session boundaries, timezones and higher-timeframe availability consistent.
Divergence does not have to appear on every timeframe to satisfy a single-timeframe rule. Requiring agreement across several charts is a new filter with its own trade-frequency and timing effects. There is no verified basis here for promising a 27% win-rate increase from adding multiple timeframes.
3. Treating Indicator Agreement as Independent Proof
Using one indicator is not inherently a mistake. Treating any indicator as a complete strategy is the problem. RSI, Stochastic, MACD and moving averages all derive from price, so their agreement can reflect overlapping information. Adding another condition may help, hurt or make little difference; evaluate it instead of assuming a fixed accuracy gain.
Assign each study a specific question. RSI or Stochastic can describe momentum; a moving average can define price location or slope. ADX measures trend strength rather than direction by itself. OBV accumulates signed volume based on price changes, while VWAP is a volume-weighted price reference. Those last two are not interchangeable measures of buying conviction.
Volume observations depend on the feed, session and whether actual traded volume or tick activity is available. Decreasing volume at a new price extreme is not a universal requirement for divergence. Nor does a rising volume reading guarantee reversal or continuation.
Start with the base rule and add one filter at a time over identical data and dates. Compare trade count, exposure, average gain and loss, net return and drawdown. RSI and Stochastic may overlap, but it is too strong to say their combination can never add value; that is a question for the defined strategy and sample.
4. Confusing Planned Risk with a Guaranteed Loss Limit
A stop specifies an intended exit condition. It does not guarantee its execution price, and an attractive target-to-stop ratio does not ensure profitability. Choose an actual-price stop from a written structural or volatility rule, then size the position and allow for trading costs.
For an illustrative share trade, a $100 risk budget with $10 reserved for estimated costs leaves $90 for price risk. Entry at 103 and a planned stop at 100 imply $3 per share, allowing 30 shares. The notional position is $3,090. If an exit gaps to 98, the price loss is $150 before costs, exceeding the original budget.
An ATR-based stop needs a stated length, multiplier and update rule. There is no universal requirement to risk 1–2% of capital on every setup. For futures, forex and leveraged instruments, account for point value, contract size, currency conversion and margin. Several correlated positions can lose together even when each position appears small.
If a strategy realizes an average gain of 2R and average loss of 1R, where R is initial price risk, its gross break-even win rate is one-third. Costs raise the required rate, and actual exits may differ from the target. A nominal 1:2 plan does not establish those realized averages.
Predefine how to handle a missed entry, expired signal, partial exit and trailing stop. Removing a stop or increasing size to recover a loss changes the strategy. Keep those deviations in the journal. No supported evidence here establishes a universal 37% drawdown reduction from a generic risk-management framework.
5. Calling Signals Strong without Measurable Criteria
A strong-looking pattern is not a calibrated probability. Define the pivot relationship, allowable separation, completed-bar timing, market condition, entry trigger and expiration. Reject a candidate because it fails a written rule, not because the later outcome makes it look weak.
For example, a bullish candidate might require the paired lows described above, then a completed close above the intervening high within a fixed number of bars after detection. That is an illustrative rule to evaluate. Enter at the next eligible price under the chosen execution model, not at the earlier low or an already-known close without a valid fill assumption.
Low timeframes are not universally weak and high timeframes are not universally strong. Spreads and turnover can matter more when expected moves are small, but opportunity and holding risk also vary. There is no defensible universal 40–50% versus 65–75% success table, or 65% versus 35% patience statistic, for undefined divergence setups.
Keep every candidate, including those that expire or never trigger. Separate selection quality from trade profitability: a correctly identified divergence can lose, while an incorrectly classified drawing can precede a gain. Evaluate the complete process rather than selecting only charts with obvious reversals.
Extended Video: RSI Divergence Traps
Bharat Jhunjhunwala’s 42-minute, 58-second tutorial discusses RSI divergence traps using chart examples. The presentation is in Hindi. Treat the examples as educational illustrations and use explicit timing, entry and risk rules when testing any proposed filter.
Build and Review the Rules in Native LuxAlgo
Open native LuxAlgo charts and add the chosen study through the Indicators picker. Inspect exact values in the Data window and save consistent settings. Use multiple chart views only when each has a defined role. The LuxAlgo Library provides additional studies; verify their calculations and signal timing individually.
Ask Quant, our coding agent to express the complete test: “Compare RSI values at two confirmed price lows, expose pivot separation and detection delay, require a later price trigger, and include expiration, costs, position sizing and exits. Keep higher-timeframe values unavailable until their stated completion.” Inspect generated code and run the strategy manually.
Check individual fills before relying on totals. Keep a later evaluation period outside parameter selection, and record every variant tried. A coding agent can help implement an idea; it does not validate future profitability or automatically choose ideal risk settings.
Understand Divergence Display Timing
Most divergence tools, including those in the Library on a Quant Chart, confirm a pivot only after it has formed, so divergence lines drawn on the price chart are positioned retrospectively even when the oscillator reading updates in real time. Do not treat the two displays as having identical timestamps.
Use a Consistent Review Checklist
| Stage | Record | Check |
|---|---|---|
| Identify | Price points, oscillator series and settings | Do the numerical relationships match the named pattern? |
| Time | Pivot, detection, higher-timeframe completion and trigger | Was every input available at the decision time? |
| Execute | Eligible price, spread, slippage and fees | Does the trade record reflect attainable fills? |
| Manage | Quantity, stop, target, expiration and portfolio exposure | What happens after a gap or failed signal? |
| Evaluate | All candidates, deviations and later sample | Does the result survive beyond selected illustrations? |
A journal makes rule changes and emotional decisions visible. Record why a setup qualified before its outcome, including a screenshot if useful, and review missed or losing trades with the same definitions. Consistency makes a strategy measurable; it does not guarantee consistent profits.
Frequently Asked Questions
Is a single divergence indicator always insufficient?
No. A strategy can use one indicator if its entry, exit and risk rules are explicit. Additional indicators should answer a specific question and be tested for incremental value rather than counted as independent votes.
Must divergence appear on three timeframes?
No. Choose timeframes according to the strategy and specify when their values become available. Requiring agreement across three charts is an additional filter, not a universal rule.
What is the difference between regular and hidden divergence?
Regular divergence compares a new price extreme with a weaker corresponding oscillator observation as a reversal hypothesis. Hidden divergence uses a price retracement and an opposite oscillator extreme as a separate continuation hypothesis.
Why can a divergence line appear on an earlier price bar?
Some displays place an annotation back at a swing identified later. Record the detection time separately from the pivot time and do not use later information to create an earlier entry.
Does a two-to-one target guarantee profitability?
No. Profitability depends on realized gains and losses, win rate, costs and execution. A target may not be reached and an exit may be worse than the planned stop.
How can LuxAlgo help avoid these mistakes?
Use native LuxAlgo charts to inspect consistent inputs and Quant, our coding agent, to express explicit rules. Inspect generated code, run the strategy manually and verify individual trades. Check TradingView toolkit timing and compatibility separately.
Read next