5 False Breakout Strategies for Traders
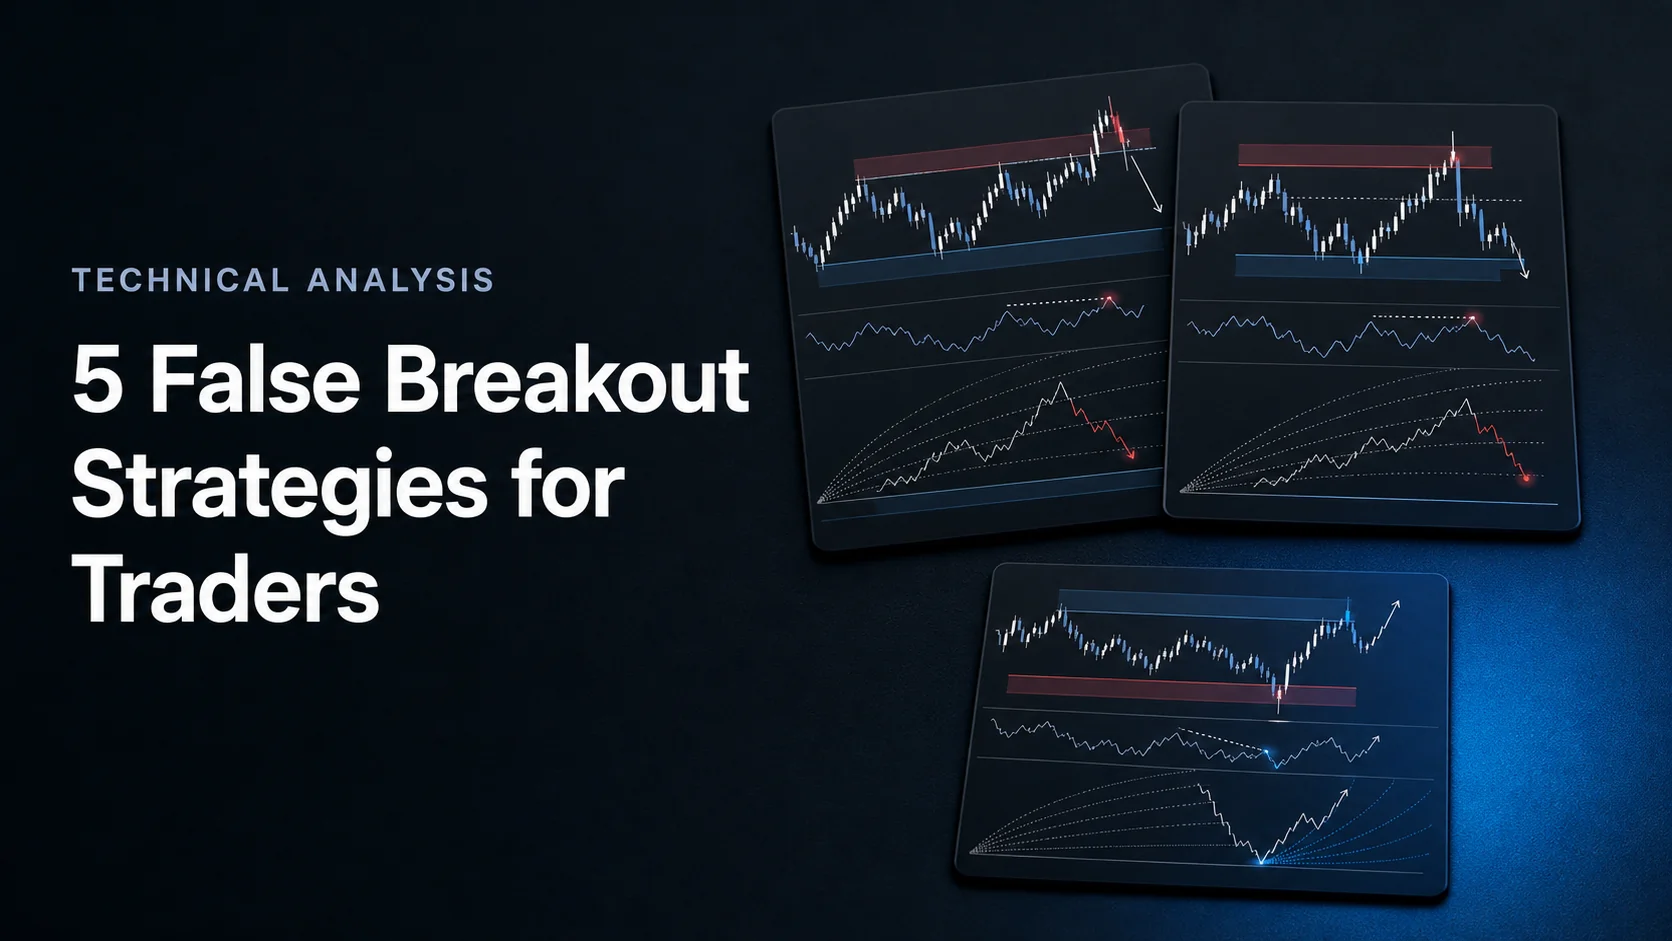
A false breakout occurs when price crosses a predefined boundary and then fails to sustain the move under your chosen rules. That failure can create a research setup in the opposite direction, but it is recognizable only after the required return or rejection occurs. A move outside a range is not automatically a trap.
The five approaches below use momentum, trend context, news timing, multiple timeframes, and options data. Treat them as hypotheses to test, not five proven sources of profit. In LuxAlgo, begin with native chart analysis and use Quant to turn a precise failure definition into a strategy you can inspect and test.
What Counts as a False Breakout?
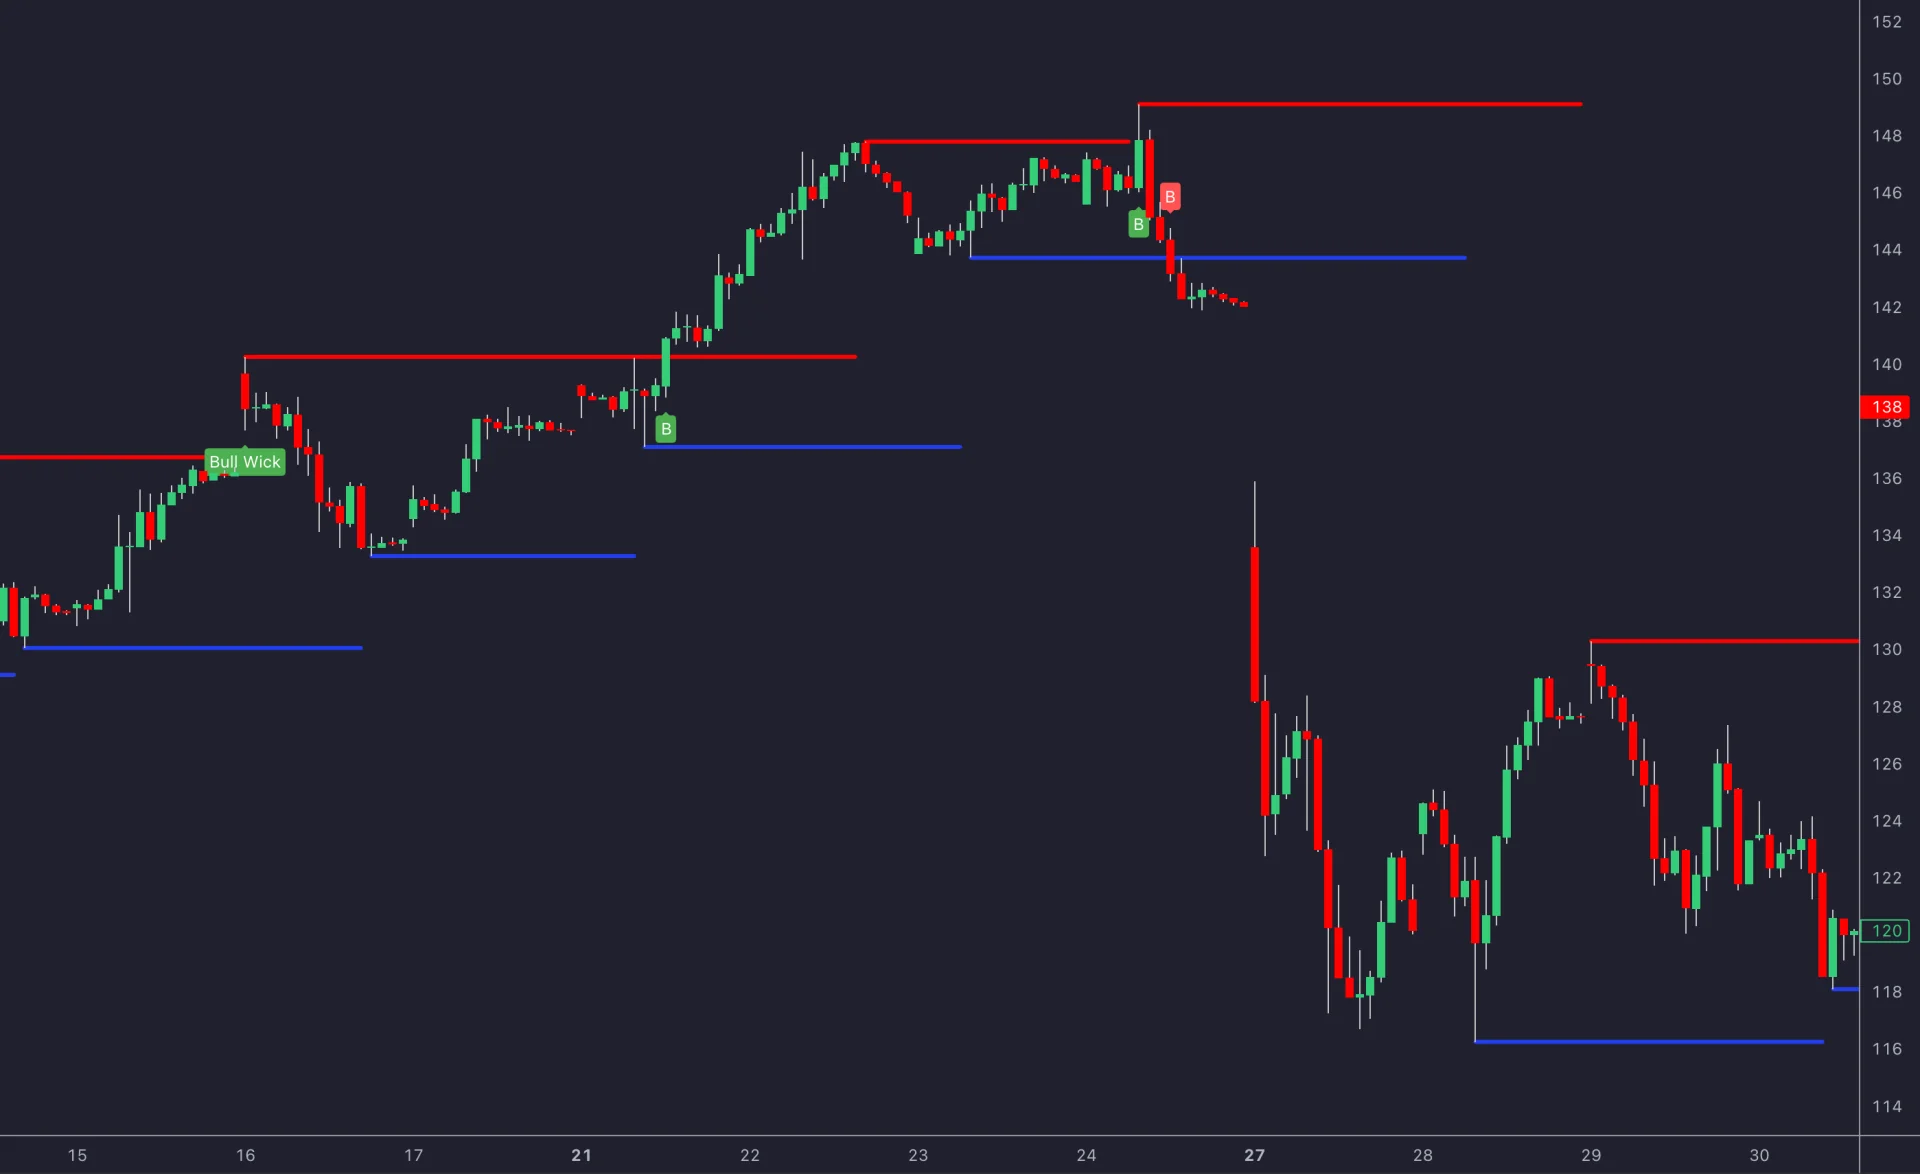
Define the boundary before the event: a prior range high, range low, or confirmed swing level. Then define a breakout and its failure separately. One example is a completed close above resistance followed within three bars by a completed close back below it. A wick above resistance followed by a same-bar close inside is a different setup and should be tested separately.
For an upside break, a return inside the range can support a potential short hypothesis; for a downside break, a reclaim can support a potential long hypothesis. Merely closing outside the level confirms the initial break, not its failure. Nor does returning to the level alone establish a reversal if price has not met the stated rejection condition.
News, changing liquidity, profit-taking, and ordinary order flow can all accompany a reversal. Price candles do not reveal whether institutions deliberately hunted stops or whether retail FOMO caused the move. Describe the observable event without assigning an unsupported motive.
| Approach | What it adds | Main limitation |
|---|---|---|
| Momentum reversal | A defined return inside the boundary, with optional momentum or volume filters. | Divergence or weak follow-through does not guarantee reversal. |
| Price trends | A rule for the broader direction or range. | A trend filter can miss a real regime change. |
| News events | Event timing, spread, and execution context. | Responses are not predictable; fills may deteriorate. |
| Multiple timeframes | Broader boundaries and a separate entry timeframe. | Unfinished higher-timeframe data and repeated price information can mislead. |
| Options data | Context from option activity and implied volatility. | Activity does not identify trader intent or prove a breakout will fail. |
1. Momentum Reversal at Failed Breakouts
Look for a predefined level, a move beyond it, and a completed return inside. Pin bars, engulfing candles, or RSI and Stochastic divergence can be optional filters. State their exact definitions and when they become available. A pivot-based divergence that needs later bars cannot be used at the earlier pivot time in a backtest.
Volume fading after a breakout may describe reduced activity, but high-volume breaks can fail and low-volume breaks can continue. Compare the same feed and session, and define the volume baseline. A forex tick-volume series is not a consolidated record of global currency trading.
An illustrative short rule could require a close above resistance and then a close below it within three bars, with entry at the next open. Record the highest high from the breakout through the failure bar as a candidate stop reference. A buffer beyond it, the target, and the maximum holding period must be specified before testing. The next open may differ substantially from the signal close.
A limit order can control the worst acceptable entry price but may never fill. Waiting for a stronger rejection can mean a later, less favorable entry. Compare these alternatives rather than assuming they improve results. Targets at the range midpoint or opposite boundary are candidates, not guaranteed destinations.
2. Use Price Trends to Evaluate the Failure
Add a trend definition that can be reproduced, such as price above a rising 50-period moving average, or a sequence of confirmed higher highs and higher lows. In an uptrend, a failed downside break can form a trend-aligned long hypothesis. In a downtrend, a failed upside break can form a trend-aligned short hypothesis.
The same failed break can also occur in a range or at a turning point. “Against the trend” is not a measured probability of failure. Record whether the market was trending or ranging using information available before the entry, then compare results by category.
Trendlines, moving averages, and market-structure markings help describe context, but several may encode overlapping price data. The Library’s liquidity and market-structure markings are analytical references, not evidence of institutional intent or an options-flow feed.
3. Treat News-Driven False Breaks as an Execution Problem
Scheduled economic releases, central-bank announcements, and company earnings can change volatility and liquidity quickly. Their price response is not reliably predictable. Record the event time, the market session, and whether the setup occurs before or after the release; an after-hours equity chart can behave differently from regular trading hours.
A time filter can be tested, but there is no universal rule to wait 15–30 minutes, halve position size, or close every trade after five minutes. Set the window around the instrument and event you are studying, and examine spreads and realistic fills. If acceptable execution cannot be modeled or the risk is unclear, skipping the event is a valid rule.
Do not place a limit order before a release merely because the later chart suggests an attractive level. Price can gap through it and continue. Scaling in increases exposure, while OCO behavior depends on the broker and order implementation. Check how cancellations, partial fills, gaps, and stop orders work rather than treating an order label as a loss guarantee.
No trend or reversal tool identifies institutional order clusters or guarantees a news reversal. Use current event information and a defined price response. Historical anecdotes about a particular earnings release or FOMC meeting cannot replace a sample of all qualifying events, including losses and no-trade cases.
4. Use Multiple Timeframes Without Future Information
Use Quant Charts, LuxAlgo’s native charting platform to separate broader context from the entry chart. A daily chart can define a completed range, a one-hour chart can show the approach, and a 15-minute chart can define the return inside. This is one arrangement, not a required spacing rule.
Keep the symbol, data source, session, and timezone consistent. Native drawing tools let you mark boundaries and manage them in the Object tree. Syncing drawings copies the same boundaries between panels; it does not create independent confirmation.
A daily candle’s final high, low, or close is unavailable while it is forming. If the entry needs a completed daily rejection, it must wait for that close. Alternatively, an intraday strategy can use the previous completed day’s level. These two rules have different information and timing.
A short-lived break on a smaller chart may not be a breakout at all under the larger chart’s close-based definition. State which timeframe defines the failure. Related assets and additional charts can add context, but do not increase position size simply because several correlated views appear to agree.
5. Use Options Data as Context, Not Confirmation of Intent
For an underlying with listed options, option activity can suggest questions about positioning and event risk. It cannot establish that a specific price breakout is false. Every options trade has a buyer and a seller, and a large print may be part of a spread, roll, hedge, or position closure.
- Put-call ratio: specify whether the numerator and denominator use volume or open interest, the underlying universe, expiries, and observation window. A value above 1 is not a universal bearish or false-breakout signal.
- Implied volatility: reflects option prices and model assumptions about future variability. Compare equivalent horizons and expiries; being below historical volatility does not measure directional conviction.
- Open interest: counts outstanding contracts, while volume counts session activity. Do not treat volume above prior open interest as proof of fresh directional bets.
- Skew and strike concentrations: can describe differences in option pricing or positioning, but neither reveals the full portfolio or provides a guaranteed support level.
The Options Industry Council explains that open interest increases when both sides open positions, decreases when both close, and is unchanged when an opening position replaces a closing one. OCC consolidates daily activity and accounts for exercise and assignment. A later published open-interest change must not be inserted into an earlier intraday decision.
For example, open interest rising from 1,000 to 1,200 contracts is a 20% increase. That arithmetic says nothing by itself about the direction of the positions or a 70% improvement in breakout reliability. Compare the same series and dates, and investigate the data’s availability time.
The Cboe VIX definition describes a constant 30-day measure of expected S&P 500 volatility derived from SPX option quotes. VIX is not a forecast of direction or a direct implied-volatility measure for every individual stock, forex pair, or cryptocurrency.
Options data requires an appropriate source and its own coverage checks. Chart tools do not supply an options chain or identify institutional options intent. Using an options spread as a hedge is a separate strategy with premium, expiry, exercise, and assignment considerations; it should not be added casually to a price-pattern trade.
Breakout Trading vs False-Breakout Trading
A breakout strategy trades in the initial break’s direction after its specified trigger. A false-breakout strategy waits for a defined failure and may trade in the opposite direction. Either can lose. Market labels such as trending or ranging do not establish universal success rates or a fixed reward-to-risk advantage.
Compare both methods on the same instrument, period, costs, and order assumptions. Include entry delay and trades that never filled. A 62% versus 54% win-rate comparison, or a 2.5R versus 1.8R comparison, would require a documented strategy and dataset; those figures should not be treated as general characteristics of the methods.
A Worked Price-Risk Example
Suppose resistance is $100.00. Price closes above it, reaches $101.00, then closes back below it within the allowed window. A hypothetical short entry fills at $99.80 with a planned stop at $101.20 and target at $97.00. Planned price risk is $1.40 per share and gross potential reward is $2.80 per share, or 2R.
A $140 price-risk budget permits 100 shares before costs and execution allowances. If total costs are $10 and the stop fills exactly at $101.20, the modeled loss is $150; the target would yield $270 net. Net reward divided by modeled loss is therefore 1.8, not 2. A worse stop fill increases the loss. Short-sale availability and borrowing costs also matter for an actual short stock trade.
Partial exits change the payoff. Taking half at 1R and the remainder at 2R yields 1.5R gross if both targets fill. A trailing stop can also end a trade before the distant target. Define these choices before testing rather than changing them after seeing the outcome.
LuxAlgo Tools for Breaks, Tests, and Retests
The Breakouts with Tests & Retests library indicator marks swing-derived areas and classifies interactions using candle opens and closes. Its live preview also uses the label “Swing Breakouts Tests & Retests.” These names should not be treated as proof of two separate tools with different volume-confirmation systems.
The current documented rules distinguish tests, breakouts, and retests. A test opens inside an area and closes beyond it in the swing’s direction; a breakout through the area changes its bias; a retest occurs after the break from the other side. The interaction rules ignore wicks. A retest label is therefore not automatically a failed breakout under a wick-based strategy.
Multiple scales the area width, Maximum Bars controls extension, and label settings affect which interactions remain visible. Swing construction and any later confirmation require a timing check; a historically drawn level is not necessarily available at its earliest displayed bar. These documented interaction rules do not establish a volume-confirmation filter.
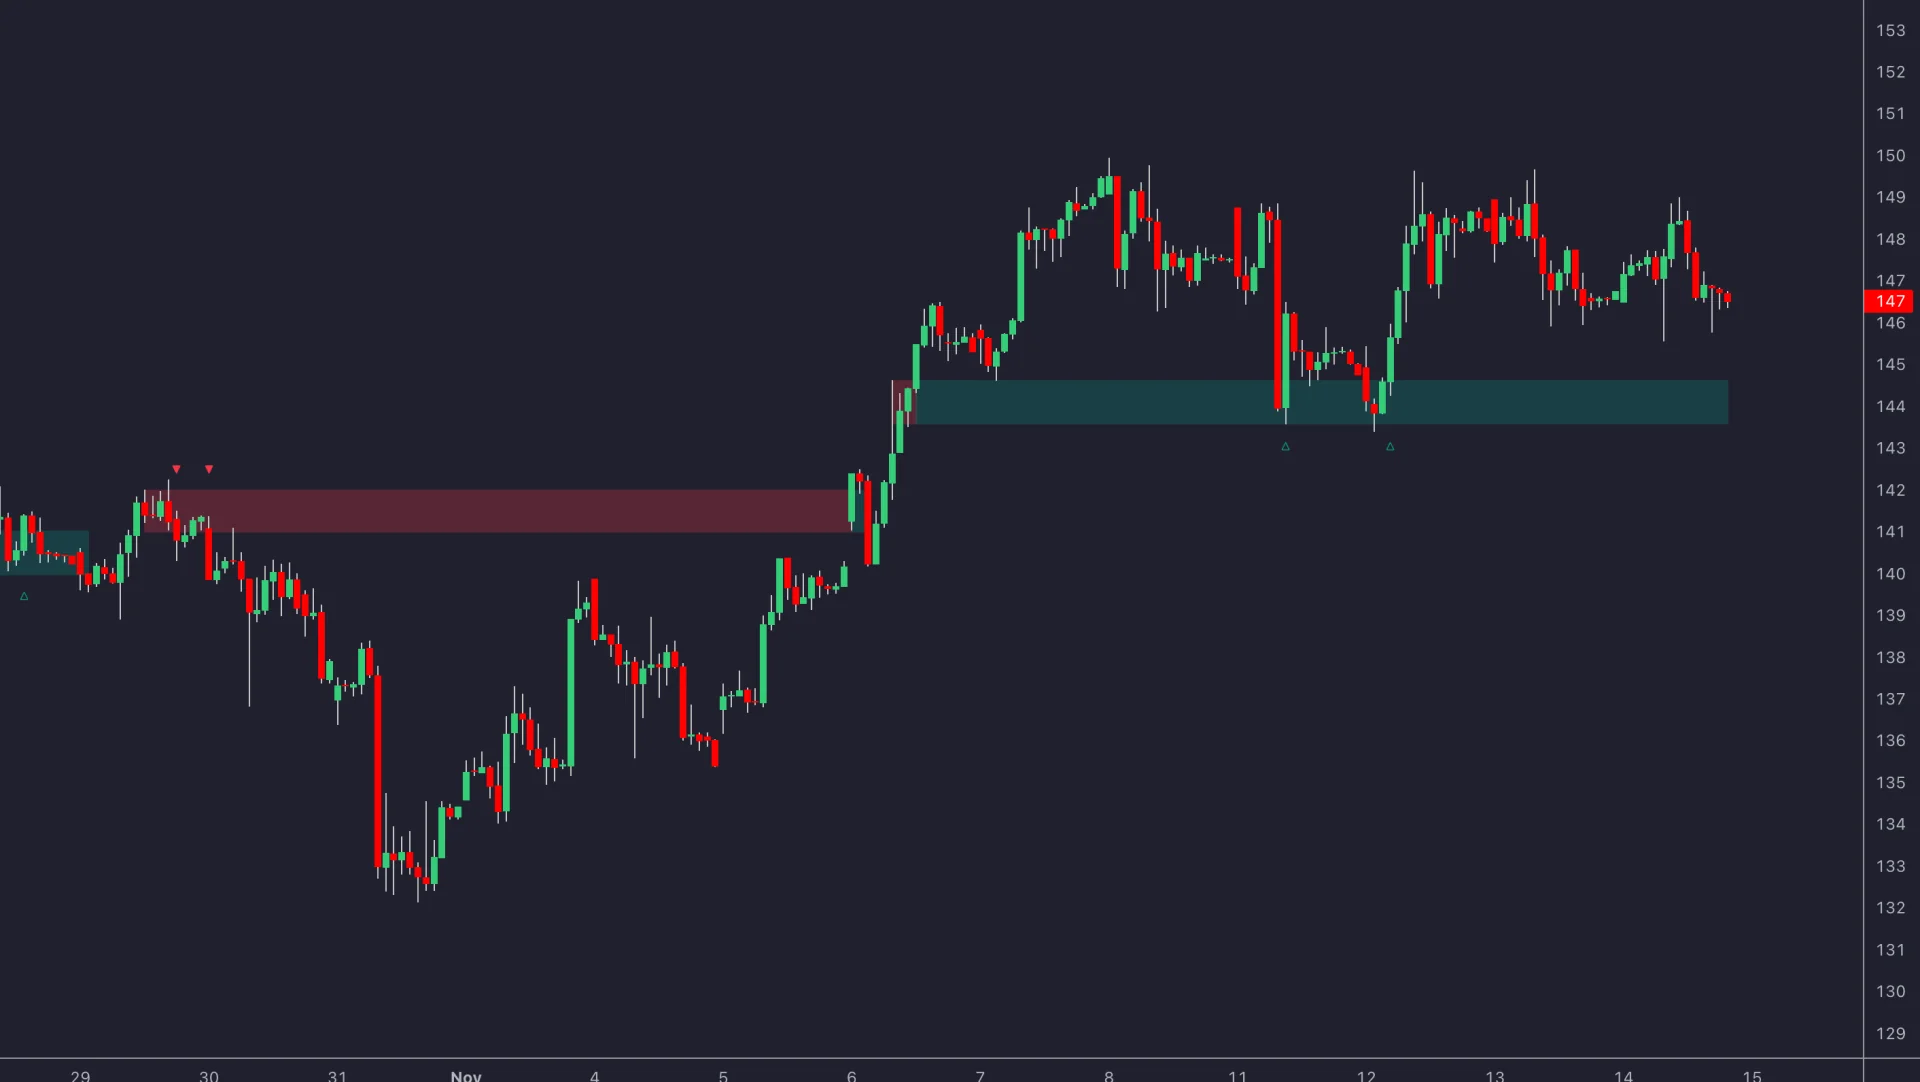
The library page provides Open on Quant Charts. Add the study to the active native chart and inspect its settings before adapting it. Keep this workflow separate from TradingView toolkit controls, and distinguish a test or retest from the exact failure event your strategy requires.
Build and Review the Strategy with Quant
Ask Quant, our coding agent to implement a specific specification: use a prior completed range boundary, define the break and return window, enter on the next bar, specify stops, targets, time exits, and position sizing, and prevent repeated entries from the same event unless explicitly allowed.
Inspect the generated code for boundary timing, pivot confirmation, order assumptions, and any future-data use, then run manually in the native strategy workflow. Inspect individual trades against the chart. Include costs and a later period that did not guide the settings; backtesting does not ensure a setup is sound or profitable.
- Prepare: freeze the level, event definition, timeframe, and data source.
- Trigger: wait for the actual failure condition, not just the initial break.
- Size: include planned stop distance, costs, and execution risk within the chosen loss budget.
- Monitor: follow the specified exit rules; a favorable volume reading does not justify ignoring them.
- Review: log all qualifying events, missed fills, costs, and outcomes, then compare each added filter with the baseline.
How to Trade Fakeouts: Video Example
The retained JeaFx tutorial illustrates one approach to fakeouts. Its historical examples and market narratives are educational context, not proof of trader identity or future performance. Apply the explicit recognition and testing rules above when evaluating a setup.
Frequently Asked Questions
How can you spot fake breakouts in trading?
Mark a boundary before the event and define how price must return inside after crossing it. Momentum, volume, and trend context can be tested as filters, but none guarantees that the breakout will fail.
What is a good way to filter out false breakouts?
For a breakout strategy, test completed closes, a defined volume baseline, or a retest requirement. Each changes entry timing and may exclude winning trades too. Compare results after costs with an unfiltered baseline.
How do you trade false breakouts effectively?
Define the failure event, entry timing, stop reference, target, sizing, and expiry before testing. Include gaps, missed fills, costs, and losing setups rather than judging the method from selected chart examples.
Can options data confirm that a breakout is false?
No. Options volume, open interest, and implied volatility provide context but do not reveal the full intent of traders or establish a future price reversal. Use the correct data timestamps and an independent price rule.
Can Quant test a false-breakout strategy?
Quant can help code a precise definition and its entry, exit, and sizing rules. Inspect the generated code and recognition timing, run manually, and verify individual trades and later-period results.
Read next