Trading Against the Trend

Trading against the trend means taking a position opposite a defined prevailing move. A counter-trend trader might buy a rebound within a downtrend or sell a correction within an uptrend. The aim can be a temporary retracement rather than a complete reversal, so the trend timeframe, target and invalidation point must be explicit.
Overbought readings, oversold readings and divergence can identify a setup to investigate. They do not make a turn inevitable. A market can keep trending while an oscillator remains stretched, and a small correction may offer too little room after spread, fees and slippage.
Use LuxAlgo’s charting and AI platform to turn the idea into a repeatable process: inspect price, levels and native indicators on Quant Charts, then ask Quant, our coding agent, to help implement and test specific entry, exit and risk rules.
Quick Tips for Counter-Trend Trading
- Define the trend: state the timeframe and the rule that makes the proposed trade counter-trend.
- Wait for an actionable trigger: separate a forming pattern from its completed break and the first realistic fill.
- Size from invalidation: use the distance between entry and stop, plus costs and an exposure cap.
- Plan the exit: decide whether the target is a nearby reference level or a larger reversal, and what happens if price stalls.
- Keep evidence: record failed setups and missed trades as well as successful examples.
How to Spot Potential Reversal Points
A counter-trend hypothesis becomes more useful when location, momentum and a price trigger have distinct roles. Location identifies where you are willing to look; momentum describes the move; the trigger defines when a trade becomes eligible. Several indicators calculated from the same prices do not necessarily provide independent confirmation.
Chart Patterns That Can Support a Reversal Hypothesis
Double tops and double bottoms form approximate M and W structures. A double top normally requires a break below the intervening low; a double bottom requires a break above the intervening high. Two similar peaks or troughs alone do not establish a completed pattern.
A head and shoulders formation has three peaks with the middle highest. Its neckline connects the reaction lows; a completed break below that boundary supplies a bearish trigger under a specified rule. The inverse formation reverses the geometry. Decide whether confirmation requires a close and whether the trade waits for a retest, which may never occur.
Rising and falling wedges describe converging boundaries. A rising wedge can precede a downside break and a falling wedge an upside break, but their roles depend on the prior move and the actual breakout. They can appear in continuation settings too. Avoid treating a forming wedge as proof of imminent exhaustion.
How Support and Resistance Levels Work
Prior swing levels, range boundaries and widely watched moving averages, including the 50-day and 200-day averages, can provide reference zones. Price can pause, reverse or pass through them. A daily moving average and an intraday level answer different questions, so record the timeframe.
Rejection wicks show that price moved away from an extreme during a candle; they do not guarantee the next candle’s direction. Higher volume describes activity, not the identity or commitment of buyers and sellers. A volume expansion around a break can be a filter to test, but it does not prove that the break will hold.
Using Divergence in Technical Indicators
Regular bullish divergence compares a lower price low with a higher oscillator low. Regular bearish divergence compares a higher price high with a lower oscillator high. RSI, MACD and Stochastics can display these relationships, but their calculations differ and they need consistent swing definitions.
The StockCharts RSI guide shows why extremes and divergence require context: RSI can remain overbought or oversold during a strong trend, and repeated divergence need not produce a major reversal. Values such as 70 and 30 are conventional thresholds, not automatic sell and buy orders.
A divergence indicator that needs bars to the right of a pivot becomes confirmable only after those bars exist. Do not backdate an entry to the earlier candle where the final chart draws the label. Define the later price trigger, such as a completed break of a local swing, and use the first eligible execution after confirmation.
Key Tools and Indicators for Counter-Trend Strategies
Give Each Indicator a Specific Job
| Tool | What it describes | Counter-trend use to test | Common mistake |
|---|---|---|---|
| RSI | Relative momentum on a bounded scale | An extreme followed by a defined recovery or divergence trigger | Fading every reading above 70 or below 30 |
| MACD | Relationships between moving averages | A momentum shift alongside a price break | Treating a delayed cross as an early turning-point forecast |
| Stochastic Oscillator | The close relative to its recent range | A specified change near a premarked level | Assuming several oscillators are independent evidence |
| Price structure and volume | Swings, breaks, rejection and activity | A completed trigger with a clear failure level | Calling a wick or volume surge a guaranteed reversal |
Inspect RSI in Its Market Regime on Quant Charts
The native RSI Regime Filter combines oscillator context with selectable regime methods: RSI level, EMA trend, ADX direction or a composite vote. With its regime filter enabled, divergence is plotted only in the neutral/ranging state under the selected method. Turning the filter off changes which signals are eligible; record that choice.
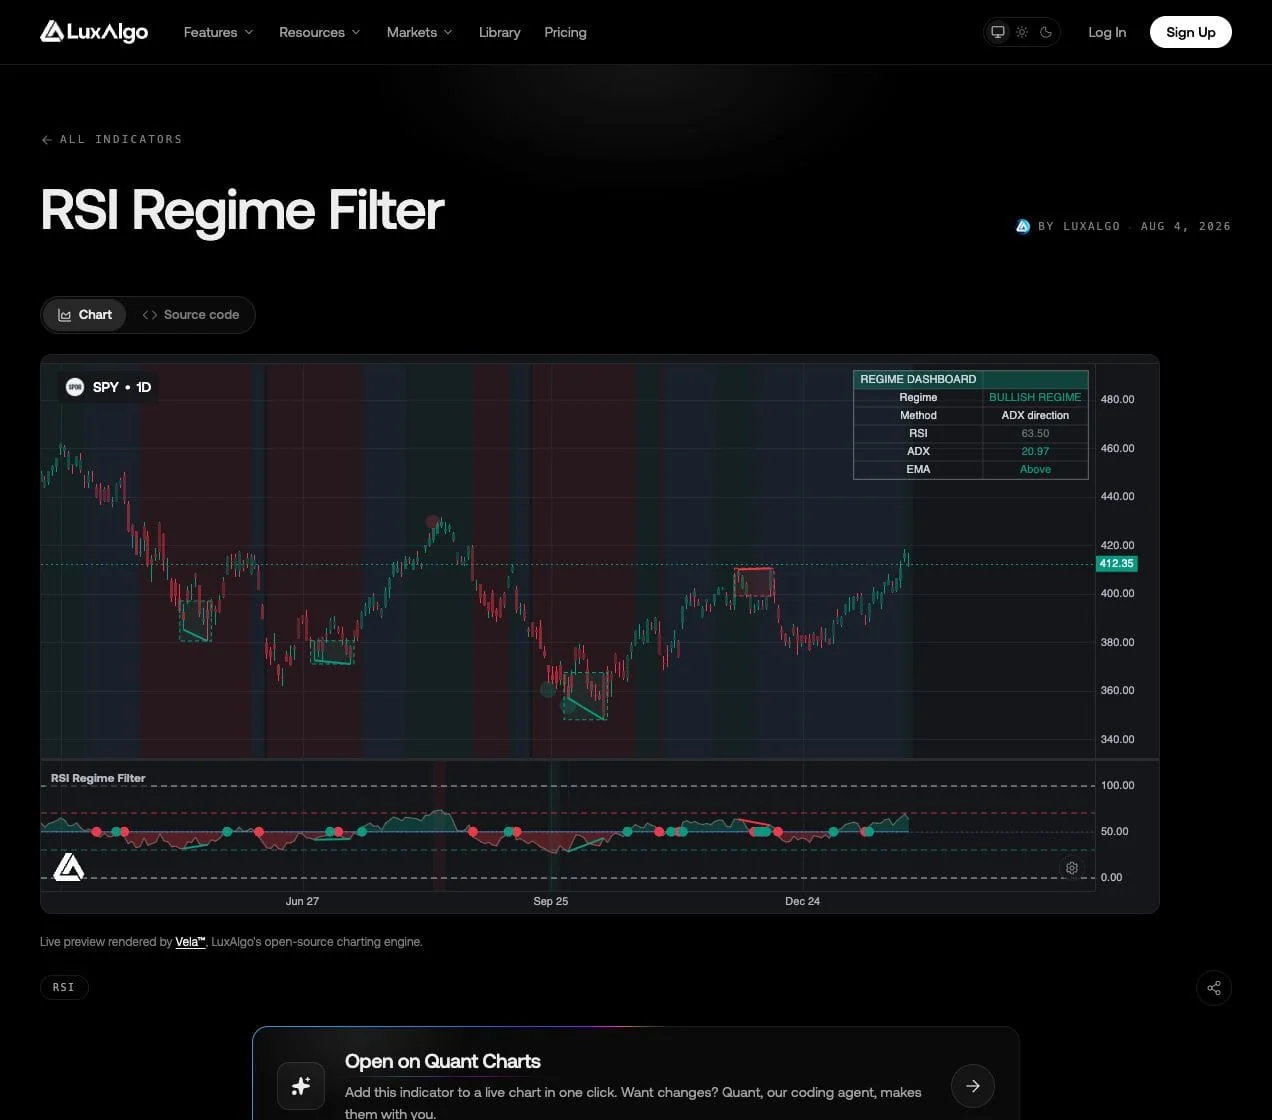
ADX itself measures trend strength; a directional regime method must also use directional information. The product’s volume bubbles mark oscillator extremes and scale with relative volume. They are not evidence of institutional identity or a calibrated probability of reversal.
Check the RSI thresholds, regime method, pivot left/right bars and any requirement that a pivot occur at an oscillator extreme. A filter that suppresses signals in trends can reduce exposure to persistent moves, but it can also miss the beginning of a reversal. Compare the filtered and unfiltered rules rather than assuming fewer signals are better.
How Quant Helps Test the Counter-Trend Hypothesis
Ask Quant to help translate a written rule into a strategy, then inspect Code and click Run yourself. Follow Making Strategies with Quant and the native backtest guide. Confirm signal timing, position size, costs and exits against individual trades rather than relying only on the summary.
A useful request specifies the symbol, session, trend timeframe, divergence confirmation, trigger, stop, target and time exit. For example: compare a fixed local-swing reversal trigger with the same rule gated by a completed-bar regime condition. Check whether the selected indicator’s logic is available to the strategy runtime; a visible marker does not automatically become a callable strategy input.
Use chronological training and evaluation periods, realistic fees and slippage, and the same execution rules in both tests. Report trade count, expectancy, drawdown, profit factor and exposure. Inspect losses during persistent trends and transitions, and test nearby parameters. Optimizing repeatedly on the same sample can fit noise.
Risk Management for Counter-Trend Trades
Position Sizing and Stop-Loss Strategies
Choose a risk budget that fits the strategy and account. The often quoted 1–2% range is a convention, not a universally safe rule; smaller budgets may be appropriate. Set the invalidation level before calculating size, and account for correlated positions and maximum notional exposure.
Whole shares = round down(cash-risk budget ÷ risk per share). For the original $25,000 example, a 2% budget is $500. If the entry-to-stop distance is $30 per share, 16 shares carry $480 planned price risk, or 1.92% of the account. Seventeen shares would risk $510, exceeding the budget. The $30 is the risk distance, not necessarily the stock’s price, and the calculation excludes costs.
ATR can help express a volatility-based stop distance, but a wider stop requires fewer shares for the same cash budget. A very narrow stop can imply excessive exposure, so apply an exposure cap as well. Futures, forex and other contracts require the appropriate point value, contract size and currency conversion rather than the share formula unchanged.
Setting Exit Strategies in Advance
Plan a price stop, target and any time exit before entering. A time stop might close a trade after a specified number of completed bars if the expected rebound has not developed. Define how it interacts with the price stop and what happens if both target and stop fall inside one historical bar.
Trailing stops can reduce risk as a trade moves favorably, but they do not guarantee locked-in gains. Investor.gov explains that a triggered stop order becomes a market order, whose execution price is not guaranteed. Limit orders control the acceptable price but may not fill. Model gaps and slippage separately from the planned stop distance.
Checking Reward-to-Risk Ratios
Risking $100 to seek $200 is 2:1 reward-to-risk, equivalently 1:2 risk-to-reward. Keep the order of the words consistent. A 2R target is a research choice, not a minimum that makes every setup attractive. If a nearby resistance level leaves only 1R of realistic room, moving the target farther away on paper does not improve the opportunity.
With full winners of 2R and full losers of 1R, the break-even win rate is 1 ÷ (2 + 1) = 33.3% before costs. At a 30% win rate, expectancy is 0.30 × 2R − 0.70 × 1R = −0.10R. Compare realized average wins and losses using the reward-to-risk and win-rate guide; partial exits, missed targets and poor stop fills change the calculation.
Worked Counter-Trend Trade: A Rebound Inside a Downtrend
Suppose a stock remains in a daily downtrend, but a completed intraday recovery above a local swing permits a hypothetical long entry at $50. A stop at $48 invalidates the setup, and nearby resistance at $54 is the planned target. The trade seeks a rebound within the larger downtrend; it does not assume the daily trend has ended.
| Item | Calculation | Interpretation |
|---|---|---|
| Account and budget | $25,000 × 0.5% = $125 | Illustrative planned price-risk budget |
| Entry and stop | $50 − $48 = $2 per share | Size from the entry-to-stop distance |
| Whole-share size | Floor($125 ÷ $2) = 62 shares | $124 planned loss; $3,100 notional exposure |
| Target at $54 | 62 × ($54 − $50) = $248 | 2R gross reward relative to the $124 price risk |
| Stop fills at $47 | 62 × ($50 − $47) = $186 loss | 1.5R loss before costs despite the original stop |
| Entry slips to $51 with the same levels | ($54 − $51) ÷ ($51 − $48) = 1R | Recalculate size: 41 shares risk $123 before costs |
If the entry changes, update the actual risk and available reward before accepting the trade. Do not preserve the original 2R label after a worse fill. A short counter-trend trade reverses the price calculations and also requires checking borrow availability, fees and the instrument’s execution constraints.
Step-by-Step Process for Counter-Trend Trading
Market Scanning and Setup Filtering
Start with a manageable list of liquid instruments and define the sessions you will review. Screen for a specific distance from a reference, oscillator condition or completed pattern only where the chosen tool supports it. A trend indicator should not be described as a divergence screener unless that capability is actually available.
Mark the prevailing trend and the level that could support a temporary reaction. Compare pullbacks with trend reversals so the intended target matches the hypothesis. A long trade can be with the trend on a five-minute chart and against it on the daily chart.
Executing and Managing Trades
- Record context: specify which timeframe defines the prevailing trend and which controls execution. Counter-trend analysis does not require every timeframe to point in the same direction.
- Wait for confirmation: use completed information and the first realistic fill after the selected trigger.
- Check room and size: calculate risk, target distance, costs and notional exposure. Skip a setup that fails the written limits.
- Manage by the plan: apply the stop, target and time exit. Do not widen the stop or add to a losing position merely because the oscillator looks more extreme.
Post-Trade Review and Improvement
Log the symbol, timeframe, regime setting, signal confirmation time, original chart, actual fills and reason for exit. Separate a failed hypothesis from an execution error. Review whether the counter-trend filter improves the baseline after costs and whether a few unusually large losses dominate many small wins.
Change rules through a documented test cycle rather than after each loss. Multiple instruments or strategy names do not automatically diversify risk when all positions are betting against the same broad move.
The Guide to Trading Counter-Trend Setups
The existing video provides another explanation of counter-trend setups. Treat its examples as educational material and verify any proposed rules through the same confirmation, cost and risk checks used for your own strategy.
Conclusion
Counter-trend trading requires a clear distinction between a stretched market and an executable reversal setup. Define the horizon, wait for the chosen trigger, size from invalidation and test realistic exits. Quant Charts supports the visual review, while Quant can help implement and evaluate the rules. The objective is a measurable process that accounts for failed reversals as carefully as successful ones.
FAQs
What is the difference between trading with and against the trend?
Trend-following trades align with a defined prevailing move. Counter-trend trades oppose that move, often targeting a temporary correction. Either approach can operate on different timeframes, so the reference horizon must be stated.
Does overbought RSI mean price will fall?
No. RSI can remain overbought during a strong uptrend, just as it can remain oversold during a downtrend. Use a defined price trigger and risk plan rather than trading the extreme alone.
What are the best ways to manage counter-trend risk?
Choose an invalidation level, size from the entry-to-stop distance, allow for costs and gaps, and cap total exposure. A stop order does not guarantee the planned exit price.
Is risking $100 to make $200 a 1:2 reward-to-risk ratio?
No. It is 2:1 reward-to-risk, or 1:2 risk-to-reward. At full 2R wins and 1R losses, the break-even win rate is about 33.3% before costs.
How can LuxAlgo help test counter-trend strategies?
Inspect native indicators and price levels on Quant Charts. Ask Quant to help implement explicit rules, inspect Code, click Run and compare the trade list and out-of-sample results with a baseline after costs.
Why do divergence labels sometimes appear on earlier candles?
A pivot-based divergence may require later bars to confirm the swing. The plotted pivot candle and the time when the signal first became knowable are different; a backtest must respect the confirmation delay.
References
LuxAlgo Resources
- Quant Charts
- LuxAlgo Quant
- RSI Regime Filter
- Making Strategies with Quant
- Native Backtest Guide
- Double Tops & Bottoms
- Moving Averages and How Traders Use Them
- Pullback Trading vs Trend Reversals
- Risk-Reward Ratio vs Win Rate
External Resources
Read next