Previous Highs & Lows
 By LuxAlgoJul 22, 2024
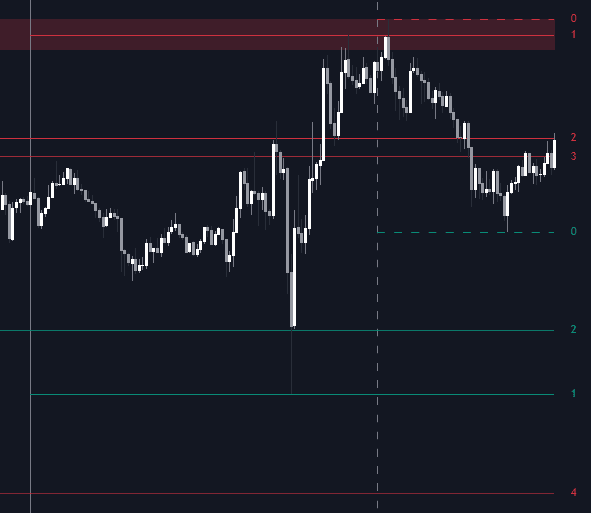
Previous Highs & Lows keeps the market's reference points on screen: the high and low of each completed interval, plotted as numbered prior-period highs and lows that remain visible as new periods form — one of the most direct tools in the levels family. Alongside the individual levels, two shaded areas built from the percentile ranks of those highs and lows outline broader zones where reactions tend to cluster.
How to Trade the Previous Highs & Lows?
- Level tests: previous highs and lows are pivotal decision points — watch for reactions there, and treat clean breaks as information about who controls the market.
- Numbering and gradient: recent levels carry lower numbers and brighter colors, so the freshest references stand out from stale ones.
- Position filtering: enable it and only highs above the current close and lows below it remain — precisely the levels price can run into next.
- Upper and lower areas: the percentile-based zones give a wider engagement region than any single level; a wider area reflects a more dispersed collection of past extremes.
Interval choice matters. Daily is the common habit, but hourly through yearly are available — just note that high intervals viewed on low timeframes can place levels far from current price.
Previous Highs & Lows Settings
- Show Last: how many previous high and low levels to display; the areas appear only when this is above 1.
- Interval: the period defining each high and low — hourly, daily, weekly, monthly, or yearly.
- Areas Width: widens or narrows the percentile-based top and bottom areas.
- Filter Based On Position: shows only highs above and lows below the current closing price.
- Minimum Gradient Transparency: fades the oldest levels so recent ones dominate visually.
Frequently Asked Questions
Which interval should I run?
Match it to your holding period: intraday traders usually watch daily levels, swing traders weekly or monthly. Higher intervals on low-timeframe charts produce levels that may sit far away and stay out of play for a while.
Can I trade breakouts of these levels, not just reactions?
Yes, and it's a natural pairing — the Breakout Detector applies signal logic to previous multi-timeframe highs and lows, making the two a coherent level-plus-trigger stack.
How do I get Previous Highs & Lows?
Free, on the LuxAlgo Library — apply it from this page, or open it in LuxAlgo's AI, Quant, to test how price behaves around each interval's levels.
Free indicator
Get free access to this indicator on the platforms below.

The Library is free. Quant makes it yours.
Pull any concept or indicator into Quant: rebuild it, retune it, or turn it into a backtested strategy of your own.