Adaptive Harmonic Forecast
By LuxAlgoFeb 11, 2026

The Adaptive Harmonic Forecast is a quantitative trading indicator designed to model market behavior using dominant price cycles and a linear trend component. By decomposing price action into multiple harmonic frequencies and projecting them forward, this trading tool provides a dynamic forecast of potential trend continuation and reversal zones. Built for traders who want more than traditional moving averages or lagging oscillators, the Adaptive Harmonic Forecast blends spectral analysis with regression modeling to anticipate where the market’s rhythm may shift next.
Unlike static indicators, this forecasting model adapts to recent price data, continuously recalculating the dominant cycles that drive market structure. The result is a forward-looking trading strategy tool that helps identify momentum shifts, cyclical turning points, and underlying trend direction across all markets and timeframes.
How to Trade the Adaptive Harmonic Forecast Indicator?
At its core, this trading indicator assumes that markets move in repeating cycles layered on top of a broader trend. By extracting the strongest frequencies from recent price data, the model projects a multi-harmonic structure into future bars.
Traders can use the forecast in several ways:
- Momentum Confirmation: When live price action aligns with the projected harmonic direction, it strengthens conviction in trend continuation.
- Reversal Anticipation: Forecasted peaks and troughs can signal potential timing windows for pullbacks or turning points.
- Trend Bias Filtering: The integrated linear trend component helps confirm the broader market direction before executing trades.
Because the projection dynamically recalculates on every new bar, it is best used as a confirmation and timing tool rather than as an exact price target generator. The goal is to anticipate directional rhythm, not predict exact tick levels.
Historical Fit & Forward Projection
The indicator displays two key components:
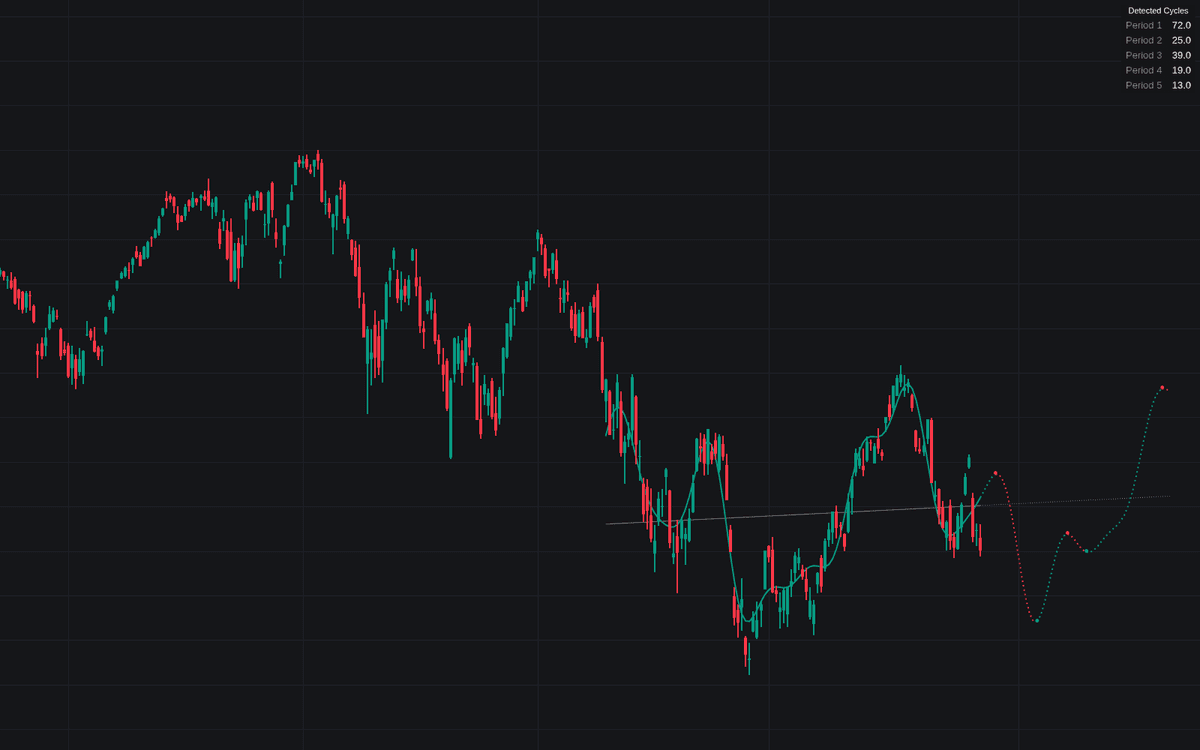
- A solid line across the historical lookback window, showing how closely the harmonic model fits actual price action.
- A dotted forecast line extending into the future, representing the projected movement of the composite cycles.
The projection is color-coded:
- Green → Projected upward harmonic movement
- Red → Projected downward harmonic movement
This forecast should be interpreted as a timing mechanism within a broader trading strategy. When the projected harmonic direction aligns with structure breaks, liquidity zones, or volume confirmation, it can significantly improve entry precision.
Trend Line & Reversal Markers
In addition to cyclical modeling, the indicator calculates a linear regression trend line across the lookback window. This provides:
- Clear visualization of overall slope (bullish or bearish bias)
- Separation of cyclical movement from structural trend
The script can also plot reversal markers (dots) at forecasted peaks and troughs. These points represent where the composite harmonic model predicts local maxima or minima, offering potential early warnings of:
- Short-term pullbacks in trending markets
- Larger reversals when aligned with structural resistance or support
For traders building systematic trading strategies, these markers can be incorporated as timing filters within algorithmic rules.
Detected Cycles Dashboard
The built-in Detected Cycles table provides transparency into the spectral engine driving the forecast.
This dashboard shows the dominant periods (measured in bars), allowing traders to determine whether current market conditions are:
- High-frequency / noisy: Short detected periods relative to the lookback window.
- Stable / structural: Longer detected periods indicating smoother, macro-level cyclicality.
Understanding whether price is dominated by short-term oscillations or longer structural waves can dramatically improve strategy selection — for example, choosing mean reversion setups in high-frequency states versus trend-following systems in longer-cycle environments.
Indicator Methodology & Technical Details
The Adaptive Harmonic Forecast operates through a two-stage quantitative modeling process:
Periodogram Logic (Cycle Detection)
The script first removes the linear trend from the lookback data to isolate pure cyclical behavior. It then performs spectral analysis across a range of candidate periods, calculating the spectral power (correlation between price and a specific frequency).
Key steps include:
- Detrending via linear regression
- Scanning multiple candidate periods
- Identifying spectral peaks
- Selecting only statistically meaningful cycles
This ensures the indicator focuses on dominant structural frequencies rather than random market noise.
Multi-Harmonic OLS Regression
Once dominant cycles are detected, the script constructs a composite model consisting of:
- Multiple sine waves
- Multiple cosine waves
- A first-order polynomial (trend component)
Using Ordinary Least Squares (OLS) regression, the indicator solves a matrix-based normal equation to determine optimal amplitudes and phase shifts. This minimizes the squared error between the model and historical price.
The fitted model is then evaluated for future time coordinates, generating a forward projection based on current harmonic structure.
This institutional-grade approach makes the Adaptive Harmonic Forecast suitable for both discretionary traders and quantitative trading strategies.
Indicator Settings & Customization
Model Settings
- Fit Lookback (N): Number of historical bars used to detect cycles and fit the harmonic model. Larger values capture broader structure; smaller values increase responsiveness.
- Extrapolation Bars: Number of future bars projected by the forecast.
- Number of Sinusoids (1–10): Controls model complexity. More sinusoids capture additional structure but may increase sensitivity.
Automatic Cycle Detection
- Min Period: Defines the shortest allowable cycle length (in bars). Increasing this value filters out very short-term noise cycles.
Visual Settings
- Show Reversal Dots: Enables or disables forecasted peak/trough markers.
- Dot Size: Adjusts marker visibility.
- Show Detected Periods: Displays or hides the cycle table dashboard.
Trend Line Controls
- Show Trend Line: Toggles the linear regression bias line.
- Trend Line Color: Customizes historical and projected trend display.
Practical Trading Applications
This trading indicator can be integrated into various trading strategies:
- Trend-following systems that enter in the direction of both the linear trend and projected harmonic slope.
- Mean reversion strategies that target forecasted troughs in bullish environments or peaks in bearish markets.
- Multi-timeframe approaches where higher timeframe harmonic projections guide lower timeframe execution.
Because the forecast adapts in real time, it reflects current market structure rather than static historical assumptions.
FAQ
What type of trading indicator is the Adaptive Harmonic Forecast?
It is a multi-harmonic forecasting trading indicator that combines spectral cycle detection with linear regression to project future price direction and identify potential reversal timing zones.
Is this indicator suitable for algorithmic trading strategies?
Yes. The mathematical structure (cycle detection + OLS regression) makes it well-suited for systematic trading models and rule-based strategies.
Does the forecast repaint?
The model recalculates on each new bar using the latest data. Historical forecasts remain fixed once the bar closes, but forward projections update dynamically as new information becomes available.
How can I access the Adaptive Harmonic Forecast?
You can get access on the LuxAlgo Library for charting platforms like TradingView, MetaTrader (MT4/MT5), and NinjaTrader for free.
Free indicator
Get free access to this indicator on the platforms below.
Unlock the entire LuxAlgo Library
Every indicator, every strategy, full charts, and complete access to Quant — our AI agent.