Concept
Dominant Cycle Measurement
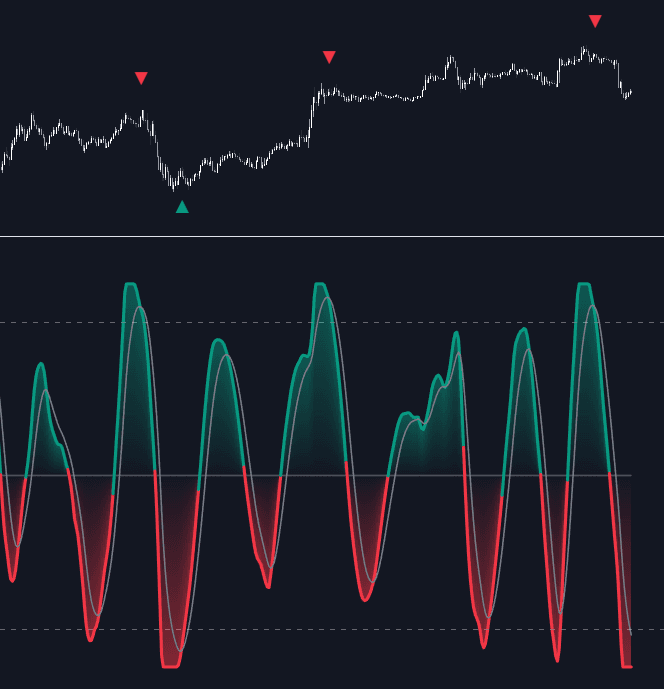
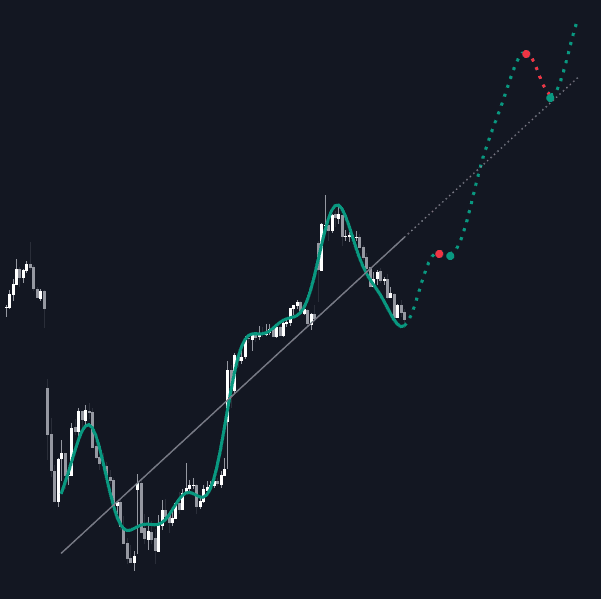
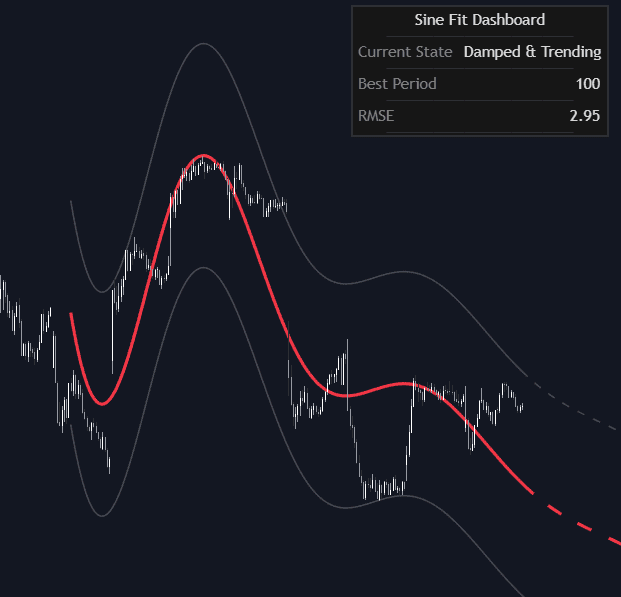
Dominant Cycle Measurement is a Statistics concept. The Library holds 3 implementations, each one a working definition you can pull into Quant.
Top Dominant Cycle Measurement indicators
The top custom implementations, built on the original standard Dominant Cycle Measurement formula.
3 total
Any of the 3 Dominant Cycle Measurement implementations below can become a backtested trading strategy — describe your rules and Quant writes the code.
What is Dominant Cycle Measurement?
Dominant cycle measurement is a family of signal-processing techniques, developed for trading largely by John Ehlers, that estimate the period of the strongest cycle currently present in price. The premise treats a price series as a mix of trend (very low frequency), one or more cycles, and noise; the dominant cycle is the periodic component carrying the most power right now, usually searched within a practical band such as 10 to 48 bars. Standard estimators include the Hilbert transform phase method, the autocorrelation periodogram, and banks of band-pass filters, typically fed by a roofing filter that strips trend and high-frequency noise first.
The point of measuring the period is adaptation. Fixed-length indicators implicitly assume one cycle length forever; feeding a measured period into an adaptive RSI, stochastic, or moving-average length lets the tool retune as the market's rhythm changes. The honest caveat comes from the premise itself: markets are not stationary sine waves. A dominant cycle is only meaningful while cycle content actually dominates; in strong trends the estimate degrades or wanders, so cycle tools are normally paired with a trend/cycle mode check before being trusted.
How to measure the dominant cycle
Ehlers-style measurement pipelines share the same three-stage shape, plus a hand-off to the indicators they tune.
- 1Precondition the series: apply a roofing or band-pass filter so trend below the search band and noise above it are removed, leaving the frequencies a trader could plausibly act on.
- 2Estimate the period: find the autocorrelation lag structure with the most power (the periodogram approach), measure the bar-to-bar rate of phase change via the Hilbert transform, or scan a bank of band-pass filters and take the strongest response.
- 3Stabilize the estimate: clamp it to the search band and smooth it, because a period that jumps around whipsaws every indicator tuned by it.
- 4Feed it forward: set indicator lookbacks as a fraction of the measured period (half the cycle is Ehlers' common prescription for oscillators) and let them update as it changes.
How traders use it
- As the tuning input for adaptive indicators: oscillator and moving-average lengths tied to the measured period aim to stay in phase with the current swing rhythm instead of a fixed default.
- As a timing map in ranging conditions: with a period in hand, phase tools project where the current cycle's trough and crest should fall, staging entries near the projected turns. Projections are schedule estimates, not commitments.
- As a regime tell: a stable, strong measurement argues for cycle-mode tactics, while a weak or erratic reading suggests trend dominates and mean-reversion timing should stand down (trend/range classifiers).
Dominant Cycle Measurement vs related concepts
FFT/spectral Analysis: A Fourier transform decomposes a fixed block of data into many frequencies at once and assumes the content is stationary across that block. Dominant cycle measurement is built to track one period bar by bar as it drifts, trading spectral completeness for responsiveness.
Fixed Time Cycles: Fixed cycle work projects a constant, pre-chosen period forward from anchor lows or dates. Measurement makes the opposite bet: that the period itself changes and must be re-estimated continuously. The two disagree exactly when the market's rhythm shifts.
Sinewave Indicator: The sinewave is a downstream display: it uses the measured cycle's phase to show where price sits within the cycle and anticipate turns. Measurement is the machinery that supplies the period; the sinewave is one consumer of it.
Concept family
Statistics
46 concepts mapped · 46 in the Library
Dominant Cycle Measurement FAQ
Turn Dominant Cycle Measurement into a trading strategy.
Take any implementation from this page into Quant, then build on it, backtest it on real data, and keep refining it in conversation.