Concept
FFT/spectral Analysis
FFT/spectral Analysis, also known as Goertzel, are Statistics concepts. The Library holds 1 implementation, a working definition you can pull into Quant.
Top FFT/spectral Analysis indicator
The top custom implementation, built on the original standard FFT/spectral Analysis formula.
1 total
The FFT/spectral Analysis implementation below can become a backtested trading strategy — describe your rules and Quant writes the code.
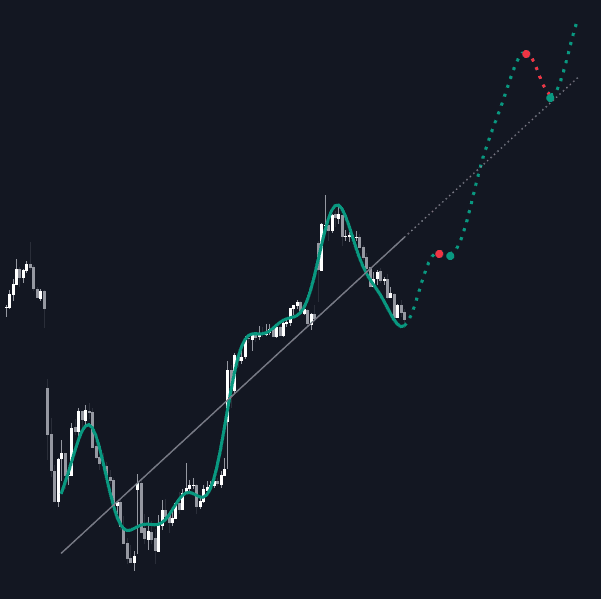
What is FFT/spectral Analysis?
Spectral analysis asks how much of a series' variance lives at each frequency. The discrete Fourier transform rewrites a window of data as a sum of sinusoids; the FFT (fast Fourier transform) is the efficient algorithm that computes it, and the resulting power spectrum shows which cycle periods carry the most energy. The Goertzel algorithm, a common alternative in trading tools, evaluates single frequency bins instead, which is cheaper when scanning a short list of candidate periods rather than the whole spectrum.
The mathematics is old and the algorithm is not: Fourier's decomposition dates to the early nineteenth century, while the FFT as computing knows it arrived with Cooley and Tukey's 1965 paper, which made spectral analysis cheap enough to be routine. Markets picked it up through the cycle-analysis tradition, from J.M. Hurst's 1970s work on price cycles to the digital-signal-processing indicators of later decades, which treat the chart as a noisy signal whose rhythms can be measured rather than guessed.
Raw price breaks the transform's assumptions: it is nonstationary and trend-dominated, so energy floods the lowest frequencies and spectral leakage smears the peaks. Practical use means detrending first (typically a high-pass or roofing filter), analyzing short windows, and reading the spectrum as an estimate for that window only. Practitioners in the Ehlers tradition often prefer the autocorrelation periodogram for exactly this reason, but Fourier analysis remains the reference frame for dominant cycle measurement.
The unavoidable trade-off is resolution against relevance. Frequency resolution improves with window length, but long windows average over regime changes, and markets rarely hold one rhythm for hundreds of bars; short windows stay relevant and blur the spectrum. Windowing functions manage leakage, spectrogram views stack windows over time to show rhythm stability, and every reading remains an estimate whose peaks shift as new bars arrive.
How to read a spectrum or spectrogram on a chart
Spectral tools plot power against cycle period, sometimes stacked over time; the reading is about peak quality, not peak existence.
- 1Confirm the preprocessing: the tool should detrend or high-pass the series first, since raw price spectra are dominated by trend energy.
- 2Find the dominant peak and read its period; that is the window's best estimate of the operative cycle length.
- 3Judge the peak's sharpness: a narrow, tall peak marks a coherent rhythm, while a broad or flat spectrum says no single cycle is in charge.
- 4Check stability over time on a spectrogram: a period band that persists across successive windows is worth adapting to; one that jumps every window is noise.
- 5Cross-check against a time-domain read, such as autocorrelation or a Hilbert-transform period estimate, before feeding the period into adaptive indicators.
How traders use it
- To estimate the dominant cycle period in a lookback window, which then sets adaptive lengths for oscillators and moving averages instead of one fixed setting.
- As a regime read: a sharp, stable spectral peak suggests a tradable cyclic rhythm, while a flat or constantly shifting spectrum argues the market is trending or too noisy for cycle tools.
- As a bandpass building block: once the dominant period is measured, filters can isolate that component and oscillators can be tuned to swing at its rate.
- To audit seasonality claims: a proposed session or weekly rhythm should appear as spectral energy at the matching period; its absence is evidence the pattern is imagination or already gone.
- As a model-selection gate: cycle-based strategies are switched off when spectral coherence collapses, the same way trend systems gate on regime labels, so the tool trades only in the conditions it assumes.
FFT/spectral analysis vs other cycle tools
Dominant Cycle Measurement: Dominant cycle measurement is the goal; the FFT is one instrument for it, alongside autocorrelation periodograms and Hilbert-based estimators. The Fourier route gives the full spectrum at once, at the cost of window-length compromises the specialized estimators try to soften.
Autocorrelation: Autocorrelation measures rhythm in the time domain, correlation of the series with its own lags, and the two views are mathematically linked. The autocorrelation route degrades more gracefully on short, noisy windows, which is why cycle tools for charts often prefer it.
Hilbert Transform: Hilbert-based estimators track an instantaneous period bar by bar instead of averaging a window, reacting faster to rhythm changes but with jitter. The FFT answers with a window-wide spectrum; the Hilbert answers with a running scalar. Many adaptive indicators use the second and audit with the first.
Concept family
Statistics
46 concepts mapped · 46 in the Library
FFT/spectral Analysis FAQ
Turn FFT/spectral Analysis into a trading strategy.
Take the implementation from this page into Quant, then build on it, backtest it on real data, and keep refining it in conversation.