ARIMA Forecasts
 By LuxAlgoOct 9, 2026
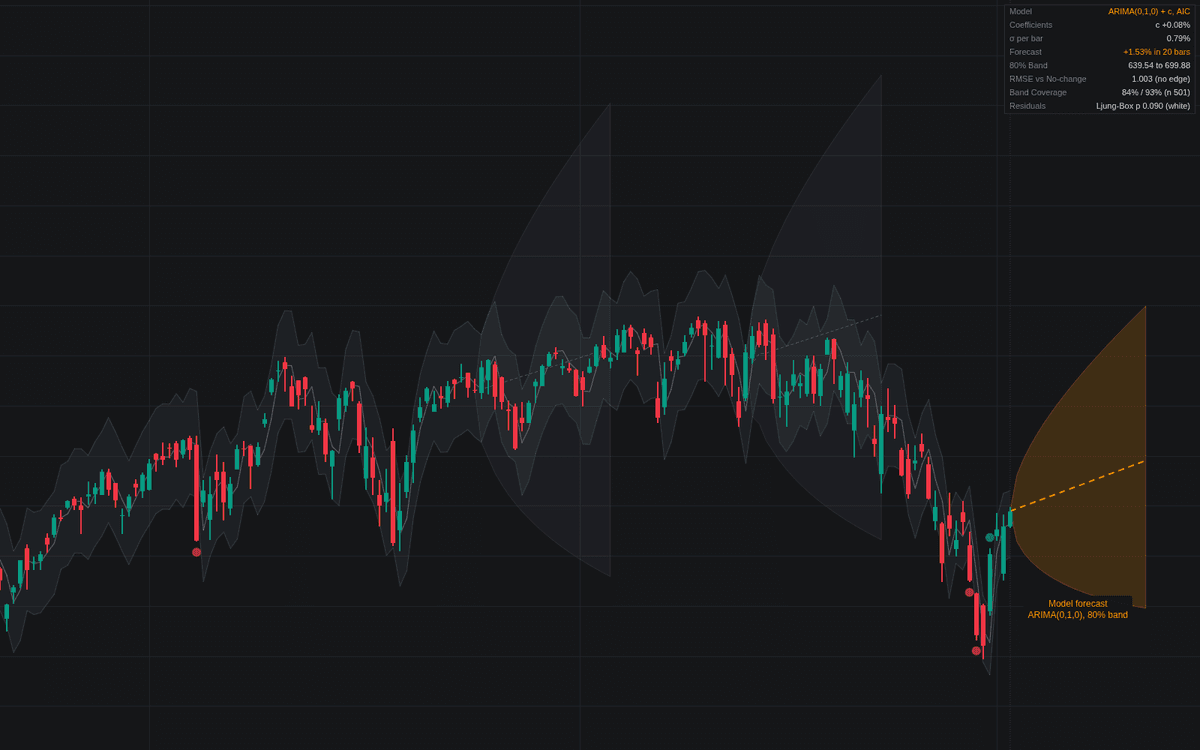

The ARIMA Forecasts indicator provides a sophisticated framework for time-series analysis by applying Autoregressive Integrated Moving Average (ARIMA) modeling to market data. By dynamically fitting to historical price action, it projects a potential future path accompanied by probabilistic uncertainty intervals. This tool allows users to quantify expectations for price movement, volatility, and trend persistence, offering a data-driven perspective on market dynamics through a rigorous statistical lens.
How to Trade the ARIMA Forecasts?
The indicator visualizes a forecasted price path based on the most recent "Fit Window" of data. The primary forecast appears as a dashed line extending into the future, while the shaded regions represent confidence intervals derived from the model’s error variance.
When observing the indicator, pay close attention to the "One-bar-ahead Forecast Track." This shows how the model performed in the immediate past. If price consistently closes outside the outer bands, it indicates that the market is experiencing volatility that exceeds the model's current statistical assumptions. Traders can use the dashboard to monitor the "RMSE vs No-change" metric; a value below 1.0 suggests the model is outperforming a random walk, indicating potential utility for the current market regime. Note that the forecast is not a guaranteed prediction of future price action but rather the conditional mean of the linear model, providing a baseline to assess whether current price behavior is statistically significant.
ARIMA Forecasts Settings
Model
- Source: The price series used for model fitting.
- Model Log Price: Fits the model to the natural log of price, suitable for percentage-based analysis.
- Order Selection: Choose between "Auto (AIC)" to automatically find the optimal p and q parameters, or "Manual" for custom input.
- Max p and q (Auto): Sets the limit for autoregressive and moving-average orders when in Auto mode.
- Re-select Every (bars): Determines the frequency at which the Auto mode re-evaluates the optimal order.
- AR Order (p), d, q: Defines the specific ARIMA(p,d,q) parameters if in Manual mode.
- Include Constant (Drift): Adds a drift term, useful for identifying a trend bias within the fit window.
- Fit Window (bars): Defines the historical data length used for model estimation.
- Refit Every (bars): Controls how often the model re-estimates coefficients to adapt to new data.
Forecast
- Forecast Horizon (bars): The number of bars the projection extends into the future.
- Inner/Outer Band (%): Sets the confidence intervals for the projection.
Out-of-sample Track
- Track Length (bars): The lookback period for evaluating the model against actual closed-bar data.
- One-bar-ahead Forecast Track: Toggles the visual representation of previous one-step forecasts.
- Past Forecasts: Displays earlier projections on the chart for comparative analysis.
Frequently Asked Questions
Free on Vela
Run it on Vela. Go further with a paid plan.
- Up to 500 strategy alerts, with webhook automation
- Up to 10× the chart history of Free
- Orderflow lookback up to full history
- Up to 100,000 monthly credits for Quant to customize it
- Futures data alongside crypto, stocks, forex and commodities

Run it on Vela. Make it yours with Quant.
Open this indicator free on Vela, our next-generation charting platform. Then ask Quant, our coding agent built into Vela, to retune it or turn it into a backtested strategy of your own.