All indicators

Daily Polynomial Regressions

By LuxAlgoMar 25, 2026

Static chart image

The Daily Polynomial Regressions indicator is a trading indicator built to map intraday price action with a daily polynomial regression curve, helping traders read trend direction, trend quality, and potential mean reversion zones inside each trading session. By recalculating a best-fit curve every day using matrix-based polynomial regression, it gives a clearer view of whether price is moving in an orderly trend, accelerating, slowing down, or starting to lose structure. For traders looking for an intraday trading strategy, trend-following tool, or session-based mean reversion indicator, this script offers a flexible way to visualize how price is behaving throughout the day.

The fit for the current day may be subject to repainting

How to Trade the Daily Polynomial Regressions Indicator

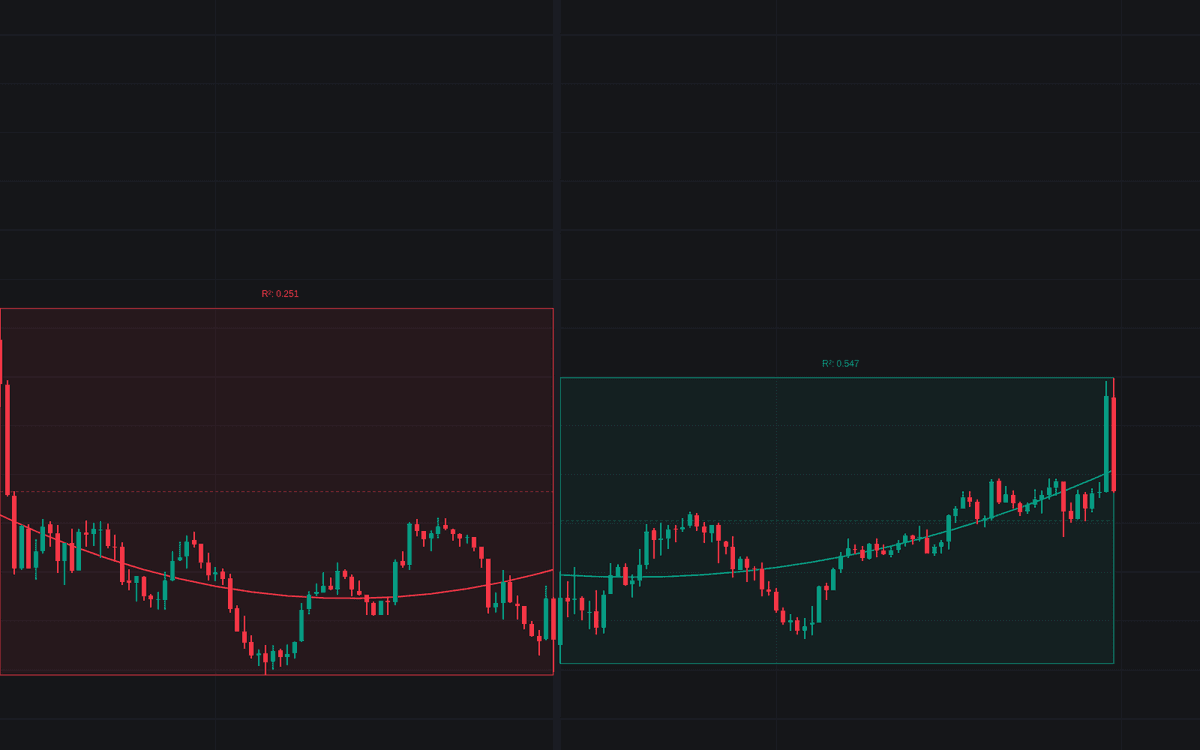
The indicator marks each trading day with a live box that expands as new highs and lows are made. Inside that session box, it draws a polynomial regression curve that represents the best-fit path of price action for the current day. Instead of relying on a basic moving average, this approach adapts to the actual shape of the session, which makes it especially useful for traders who want a more nuanced view of intraday momentum.

Because the regression is recalculated throughout the day, the curve can help traders understand whether price is trending smoothly, becoming unstable, or stretching too far away from its statistically fitted path.

The Daily Polynomial Regressions indicator is especially useful for identifying:

  • Intraday Trend Direction: The box and regression curve change color depending on whether the current regression endpoint is above or below the day’s starting point. This gives traders a quick read on whether the session is behaving in a bullish or bearish way.
  • Trend Strength: A higher R² value means price is tracking the regression curve more closely. In practical terms, this suggests the day’s trend is cleaner, more structured, and easier to follow as part of a trend trading strategy.
  • Mean Reversion Opportunities: Because the curve acts like a dynamic, session-based average, traders can use it to spot when price is becoming extended above or below the expected path of the day.

Traders can use this trading indicator in several ways. In trending conditions, the regression curve can serve as a visual trend guide, helping confirm whether price is continuing in a steady bullish or bearish structure. In choppier sessions, distance from the curve can highlight overextended moves that may revert back toward the fitted path. This makes the indicator useful for both momentum traders and traders looking for intraday pullback or reversion setups.

Indicator Logic and Trading Concepts

How Polynomial Degrees Affect the Regression Curve

The indicator allows users to choose different polynomial degrees, which directly changes how sensitive and flexible the regression curve becomes:

  • Degree 1 (Linear): Fits a straight line and is best for simple directional sessions. This is the cleanest setting for traders who want a basic trend indicator without extra curvature.
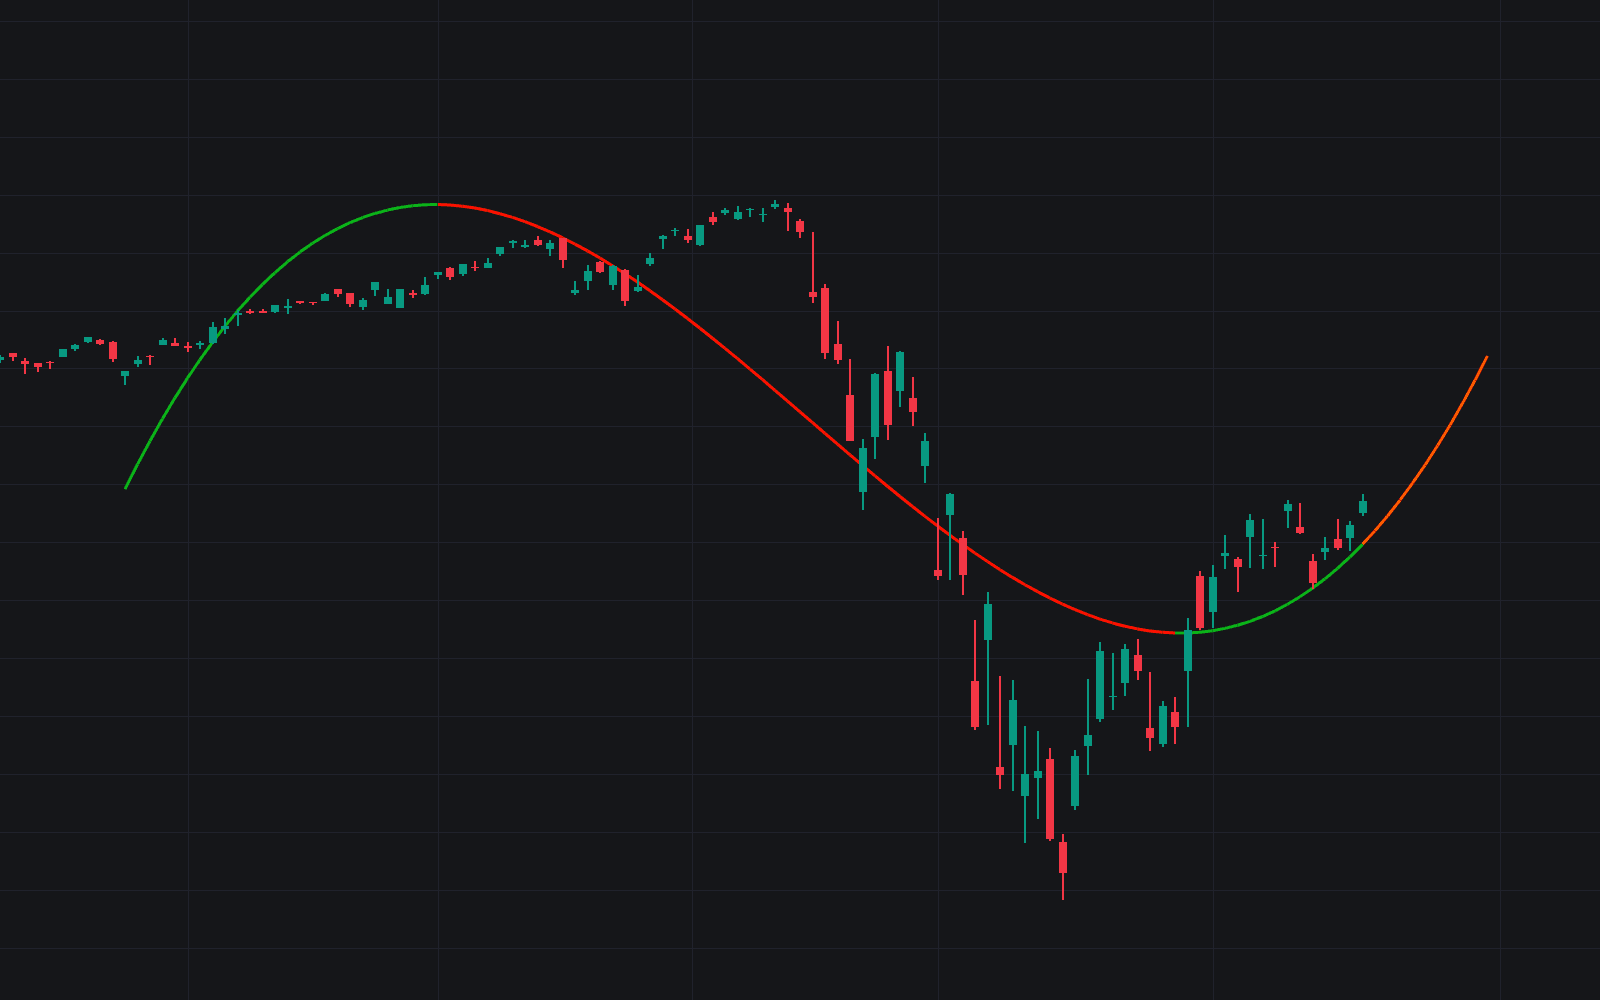
  • Degree 2 (Quadratic): Fits a parabola-like curve, which can help reveal trend acceleration, deceleration, or rounded reversals during the day.
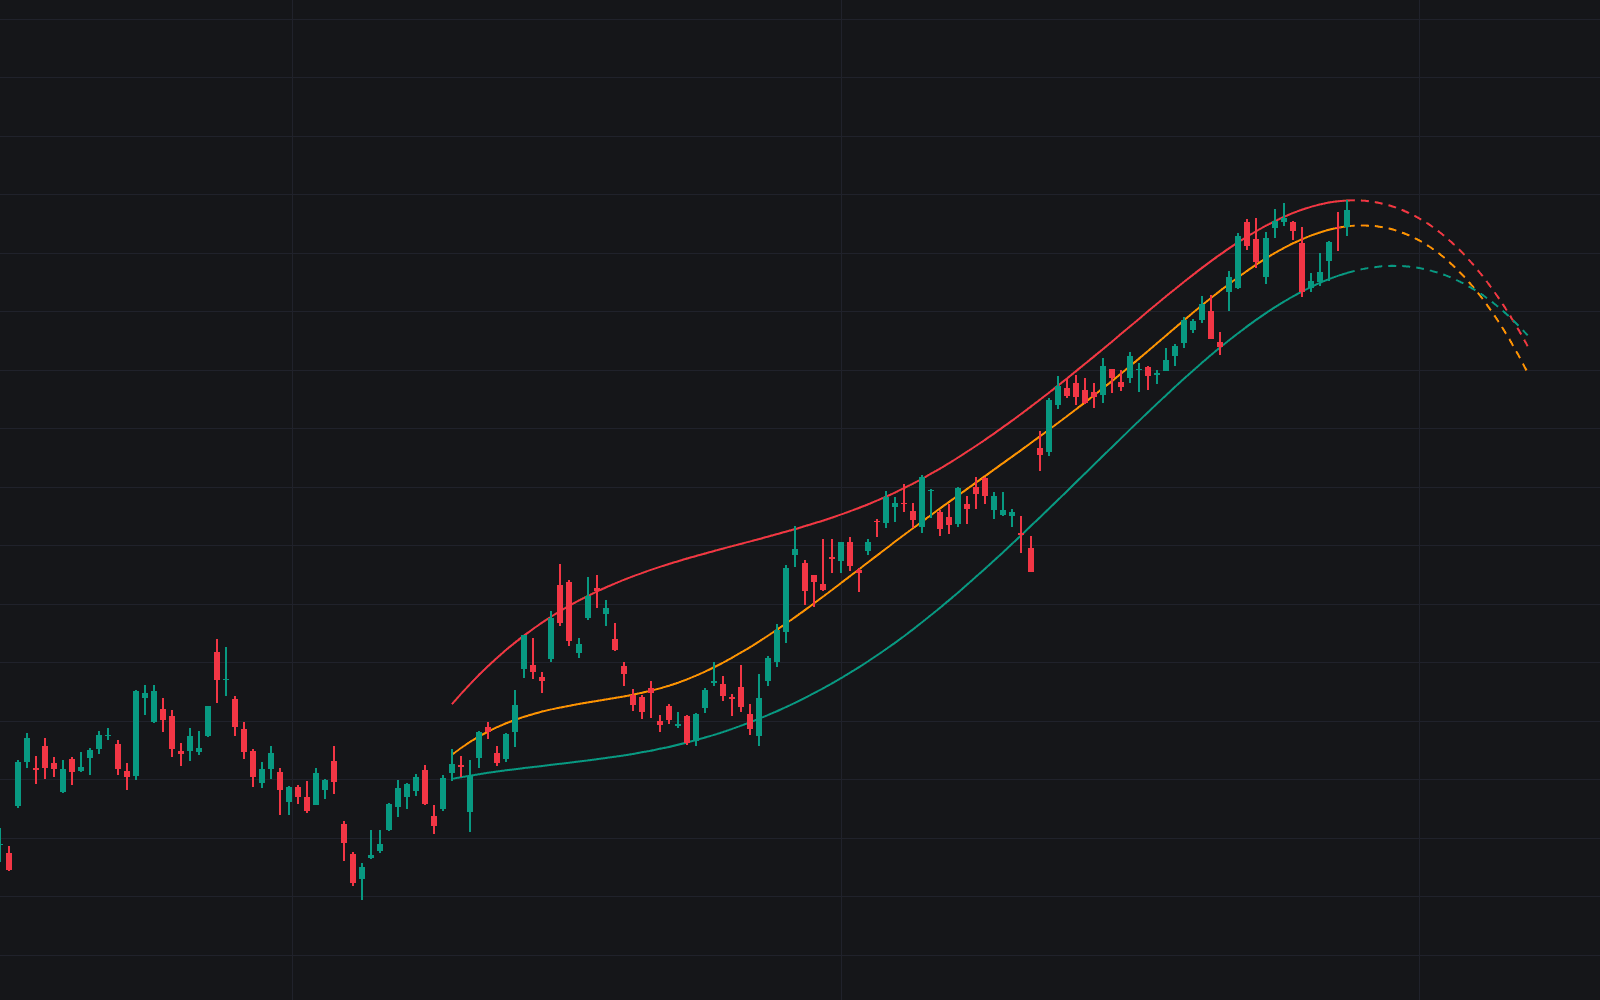
  • Degree 3 (Cubic) & 4 (Quartic): These higher-degree settings create more flexible curves that can respond to multiple momentum shifts inside the same session. They can be useful when price action is more complex, but they may also be more reactive.

In general, lower degrees provide cleaner structure, while higher degrees provide more adaptability. Traders can choose the setting that best matches the asset’s volatility and their preferred intraday trading strategy.

Matrix-Based Regression Calculation

A key feature of this script is that it does not approximate the regression in a simplistic way. Instead, it uses matrix calculations to solve the Normal Equation:

(X'X)B = X'Y

This allows the indicator to calculate the polynomial coefficients directly for the selected degree. In simpler terms, the script mathematically finds the curve that best fits the day’s price action up to the current bar.

All calculation accumulators reset at the start of each new day. This is important because it keeps the indicator strictly focused on intraday price behavior rather than blending information from previous sessions. For day traders, this daily reset makes the tool more relevant than broader regression tools that do not separate one session from the next.

What the R-Squared Value Means

The R² statistic is calculated as:

1 - (SSres / SStot)

R² measures how much of the day’s price variation is explained by the polynomial model. The closer the value is to 1.0, the more closely price is following the regression curve.

From a trading perspective, this can be very useful:

  • A high R² suggests the market is moving in a more organized and statistically consistent way.
  • A low R² suggests the session is more erratic, noisy, or less trend-friendly.

This means the R² label can act as a trend quality filter. Traders may prefer trend-following entries when R² is elevated and become more cautious when the fit is weak.

Settings Explained

  • Polynomial Degree: Sets the complexity of the regression curve. Lower values create smoother and simpler trend lines, while higher values create more adaptive curves that can follow more detailed intraday shifts.
  • Show Median Line: Displays a dashed midpoint line based on the daily high-low range (HL2). This can help traders gauge where price is trading relative to the center of the day’s range.
  • Show R² Label: Shows the R-squared reading at the top of the daily session box so traders can quickly judge how well the regression curve fits current price action.
  • Bullish Color: Defines the color used when the daily regression is signaling a positive session structure.
  • Bearish Color: Defines the color used when the daily regression is signaling a negative session structure.
  • Fill Transparency: Controls how visible the daily background box appears on the chart.

Why Traders Use the Daily Polynomial Regressions Indicator

This trading indicator can be useful for traders who want more than a standard moving average or trend line. Since it recalculates a polynomial regression inside each daily session, it provides a more session-specific view of price structure. That makes it valuable for:

  • Intraday trend analysis
  • Session-based mean reversion trading
  • Momentum confirmation
  • Identifying orderly versus chaotic market conditions
  • Visualizing price curvature rather than only straight-line direction

For traders building an intraday trading strategy, the Daily Polynomial Regressions indicator can be used alongside volume tools, volatility tools, support and resistance, or price action confirmation to improve timing and market context.

FAQ

What does the Daily Polynomial Regressions indicator do?

It fits a polynomial regression curve to the current trading day’s price action so traders can better understand trend direction, trend strength, and potential mean reversion areas during the session.

How is this different from a moving average?

A moving average smooths price using past values, while this indicator builds a best-fit polynomial curve for the current session. That means it can better reflect curvature, acceleration, and changes in intraday structure.

Which polynomial degree should traders use?

Degree 1 is best for simple trend analysis, Degree 2 is useful for curved momentum shifts, and Degrees 3 to 4 are better for more complex intraday movement. Many traders start with lower degrees for cleaner signals and only increase complexity when needed.

What does a high R² value mean?

A high R² means the day’s price action is tracking the regression curve closely. This usually points to a cleaner and more organized market structure, which can be helpful for trend traders.

Does the Daily Polynomial Regressions indicator repaint?

Yes. The fit for the current day may repaint because the regression updates as new intraday price data comes in.

How can I access the Daily Polynomial Regressions indicator?

You can get access on the LuxAlgo Library for charting platforms like TradingView, MetaTrader (MT4/MT5), and NinjaTrader for free.

Free indicator

Get free access to this indicator on the platforms below.

TradingView
NinjaTrader
MetaTrader 4/5

Unlock the entire LuxAlgo Library

Every indicator, every strategy, full charts, and complete access to Quant — our AI agent.