Concept
Polynomial Regression
Polynomial Regression is a Statistics concept. The Library holds 4 implementations, each one a working definition you can pull into Quant.
Top Polynomial Regression indicators
The top custom implementations, built on the original standard Polynomial Regression formula.
4 total
Want to trade Polynomial Regression? Any of the 4 implementations below is one prompt away from a backtested strategy in Quant.
.png&w=3840&q=75)
What is Polynomial Regression?
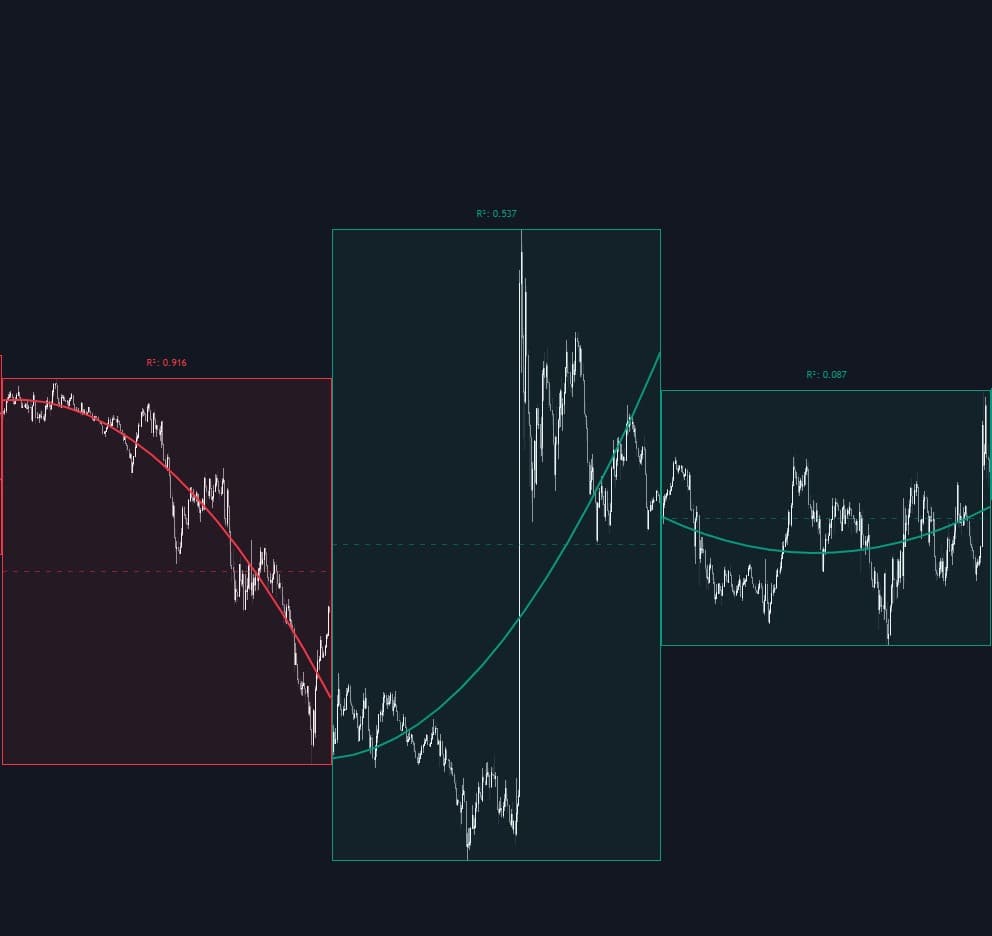
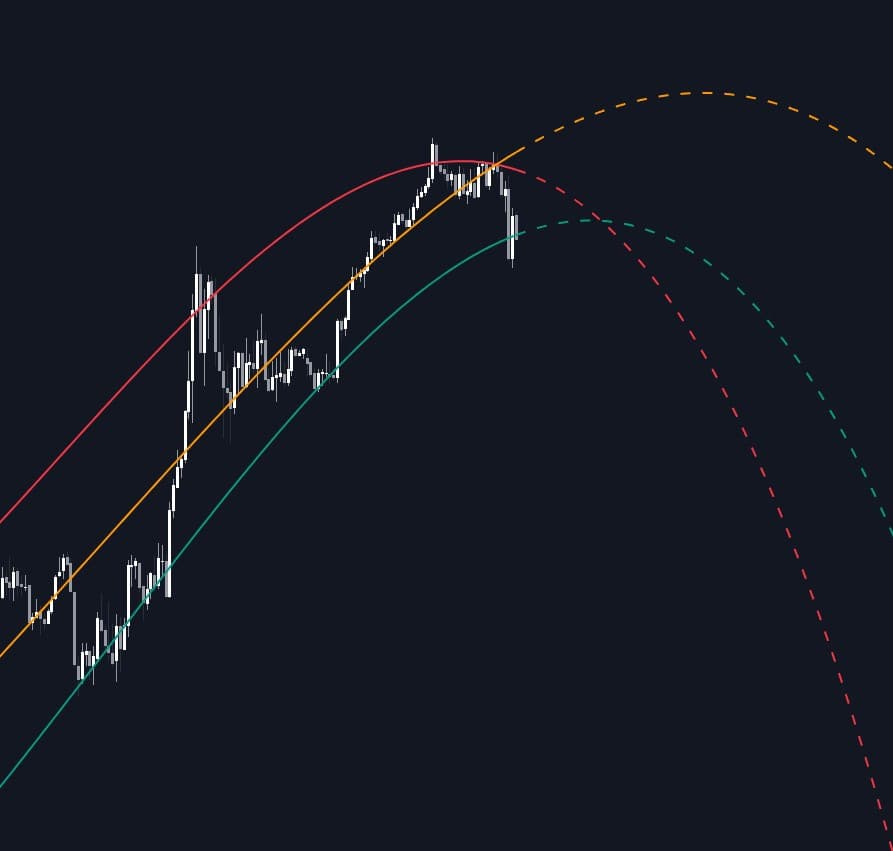
Polynomial regression fits a curved line to price by least squares: instead of a straight linear regression, the model adds squared, cubed, and higher powers of the bar index, then solves for the coefficients that minimize the squared distance between curve and price over a lookback window. Degree controls flexibility: degree 1 is a straight line, degree 2 a parabola with one bend, degree 3 allows two bends. Chart implementations usually draw the fitted curve through the window, often with bands offset by a multiple of the residual standard deviation, in the spirit of a standard-error channel.
The appeal is that real swings curve, and a straight fit misrepresents them; a low-degree polynomial can trace an arcing trend and expose acceleration or rollover in its right-edge slope. The costs are just as structural. Higher degrees chase noise and oscillate hardest near the window's edges, exactly where decisions are made; the entire curve is refit on every bar, so drawn history revises; and extrapolating a polynomial beyond its window is fragile, with small coefficient changes swinging the projected path widely.
The edge instability has a name in numerical analysis: the Runge phenomenon, the tendency of high-degree polynomial fits to oscillate wildly near the ends of their interval even when they behave in the middle. It is why careful implementations center and rescale the bar index before fitting, or work in an orthogonal polynomial basis, choices that stabilize the arithmetic without changing the statistical trade-off. The degrees of freedom are worth counting too: a degree-d fit estimates d+1 coefficients, so on short windows a high degree leaves the curve nearly free to reproduce the data, fit without meaning.
The Library shows the design space. LuxAlgo's Polynomial Regression Extrapolation draws the fitted curve and its forward extension, making the scenario-path use explicit; Daily Polynomial Regressions re-anchors a fresh fit to each session so the curve becomes an evolving intraday mean; and the Spline Quantile Regression Channel replaces the single global polynomial with piecewise fits through chosen quantiles, trading global curvature for local flexibility. Across all of them the honest workflow is the same: read the curve for shape, standardize the residual before comparing stretch across regimes, and treat any projection as an assumption made visible, in the spirit of dominant cycle and other estimated-structure tools.
How to calculate a polynomial regression
The fit is ordinary least squares with extra columns for the curvature terms.
- 1Choose a window N and a degree d. On charts, degree 2 or 3 covers most useful curvature; higher degrees mostly model noise.
- 2Build the predictors: the bar index and its powers up to d, usually centered or rescaled first for numerical stability.
- 3Solve the least-squares problem for the d+1 coefficients that minimize the sum of squared residuals between curve and price.
- 4Draw the fitted curve across the window, optionally adding bands at multiples of the residual standard deviation, and refit as each new bar arrives.
- 5Standardize the residual, a z-score against its own recent spread, when comparing stretch readings across windows, symbols, or volatility regimes.
How it's calculated
A least-squares fit of a degree-k polynomial to price over a lookback window, producing a curved trend line through recent data.
Charting versions draw a channel by offsetting the fitted curve by a multiple of RMSE (commonly 2) or by the maximum deviation; some use the unbiased divisor n - k - 1 in RMSE.
High degrees oscillate near the window edges, and the whole curve repaints as the window slides forward.
Solvers usually center or rescale t before fitting to avoid numerical instability.
How traders use it
- As a curved trend baseline: the right-edge slope and its change give a read on trend direction and acceleration or inflection that a straight fit smooths away.
- As a mean-reversion frame: distance from the fitted curve, measured in residual standard deviations, flags stretched excursions, with band tags treated as fade candidates in ranging conditions rather than automatic signals.
- As a detrender: subtracting the fitted polynomial isolates the residual wiggle, a common preprocessing step before cycle or oscillator analysis.
- As a projection: some tools extend the curve forward as a scenario path. Treat it as a sketch of what happens if current curvature persists, not a forecast; reliability decays quickly outside the fitted window.
- As a session-anchored mean: refitting the polynomial from each day's open turns it into an evolving intraday baseline with bands, a curved alternative to session averages for framing the day's stretch.
Polynomial Regression vs related concepts
Linear Regression: Linear regression is the degree-1 special case: one slope, no curvature. The polynomial's extra terms track arcing moves better inside the window, but they add overfitting and edge-instability risk the straight line does not have.
LOESS Smoothing: LOESS fits many small local regressions and stitches them together, so its shape is driven by neighborhoods of data. A polynomial regression fits one global curve, so a shock at one end of the window bends the fit everywhere.
Polynomial Regression Band: The band is the packaged application: the same fitted curve plus envelopes at a multiple of the residual deviation. The regression itself is the estimator; the band adds the volatility casing used for tag-and-fade or breakout reads.
More Polynomial Regression implementations
Concept family
Statistics
46 concepts mapped · 46 in the Library
Polynomial Regression FAQ
Turn Polynomial Regression into a trading strategy.
Take any implementation from this page into Quant, then build on it, backtest it on real data, and keep refining it in conversation.