Elder Ray
 By LuxAlgoApr 13, 2020
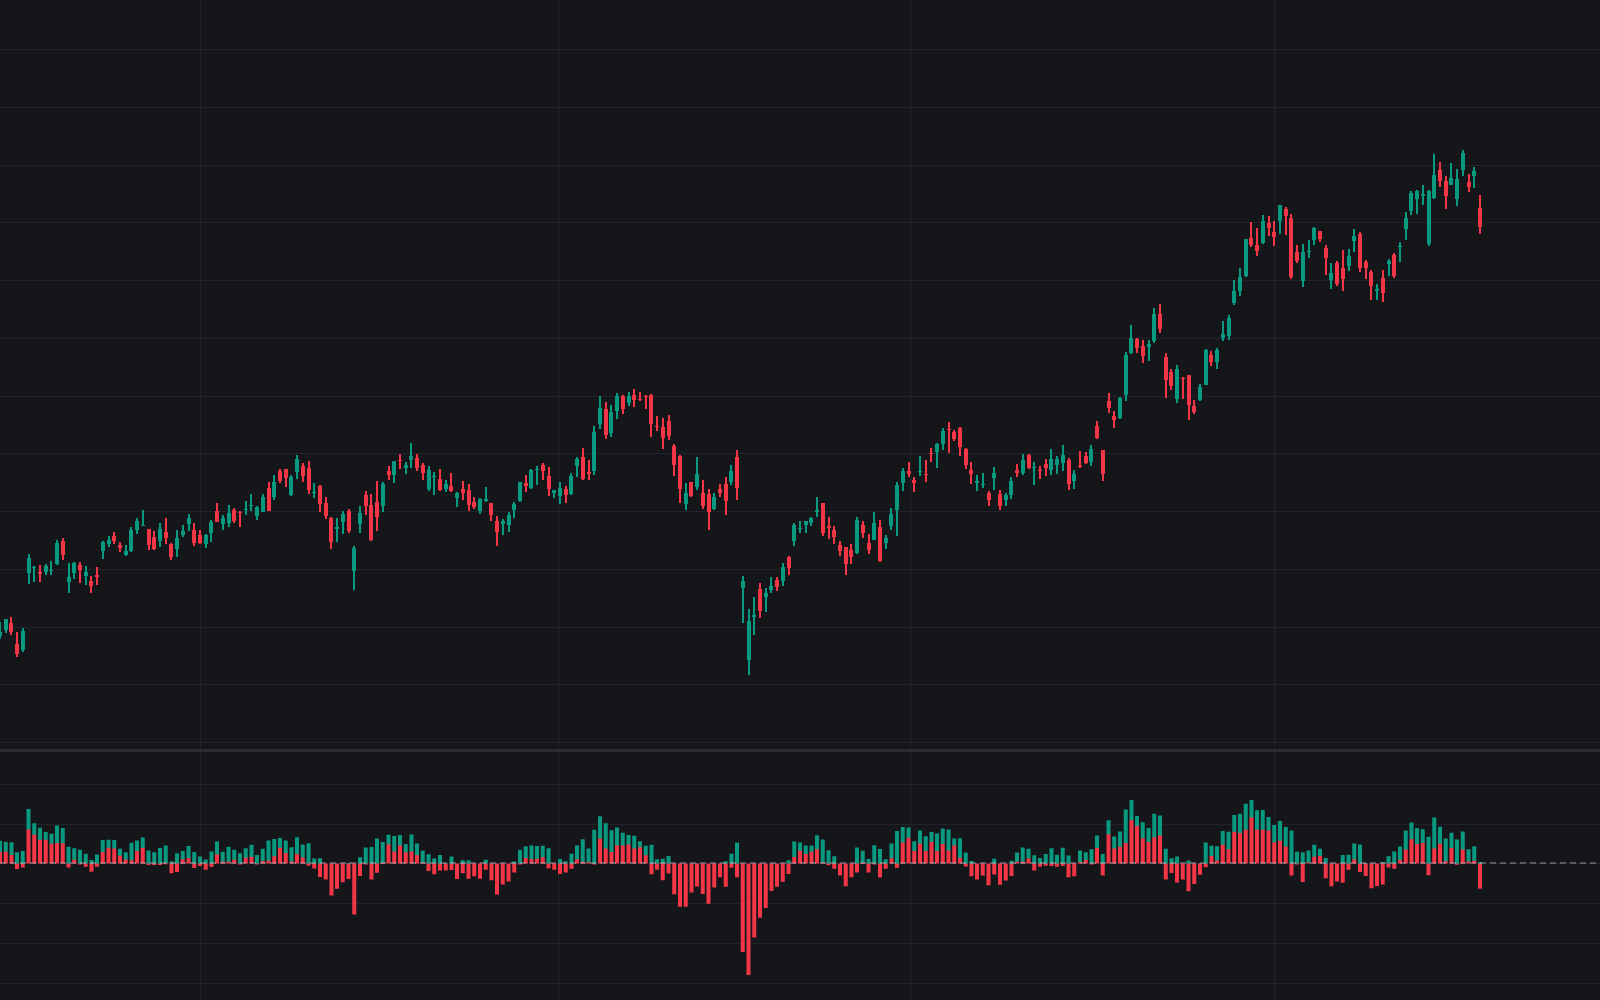

Elder Ray measures buying and selling pressure relative to trend by subtracting a 13-period EMA of closes from each bar's high and low: high minus EMA is Bull Power, low minus EMA is Bear Power, both plotted as histogram columns around a zero line. Positive Bull Power shows buyers pushing price above the average; negative Bear Power shows sellers dragging it below. Keeping the two sides separate is the tool's appeal.
This build is the standard raw implementation with the classic EMA length of 13. Bull Power and Bear Power print as green and red columns in their own pane, with a dashed zero line.
How to Trade the Elder Ray?
- Bear Power negative but rising in an uptrend: sellers weakening on a pullback, Elder's classic buy setup, strongest when price makes a lower low while Bear Power makes a higher low.
- Bull Power positive but falling in a downtrend: buyers failing to hold price above value, the mirrored short setup.
- Bull Power crossing below zero: even the bar's high sits under the EMA: one-sided selling; the Bull Power zero-cross alert covers both directions.
- Bear Power crossing above zero: the whole bar is above the average: unusually one-sided buying, tracked by the Bear Power zero-cross alert.
- Weakening extremes: smaller Bull Power peaks at fresh highs, or shallower Bear Power troughs at fresh lows, warn the move carries less force.
Elder meant the tool to be trend-gated: set direction first (the slope of the same 13-period EMA is the natural gauge), then time entries with the counter-trend histogram instead of trading every zero cross.
Elder Ray Settings
- EMA Length (default 13): bars in the EMA of closes used as the reference for both series. Longer measures pressure against a slower consensus of value; shorter hugs price and flips signs more often. The two remaining inputs only set column colors.
Frequently Asked Questions

The Library is free. Quant makes it yours.
Pull any concept or indicator into Quant: rebuild it, retune it, or turn it into a backtested strategy of your own.