Gator Oscillator
 By LuxAlgoJul 27, 2026
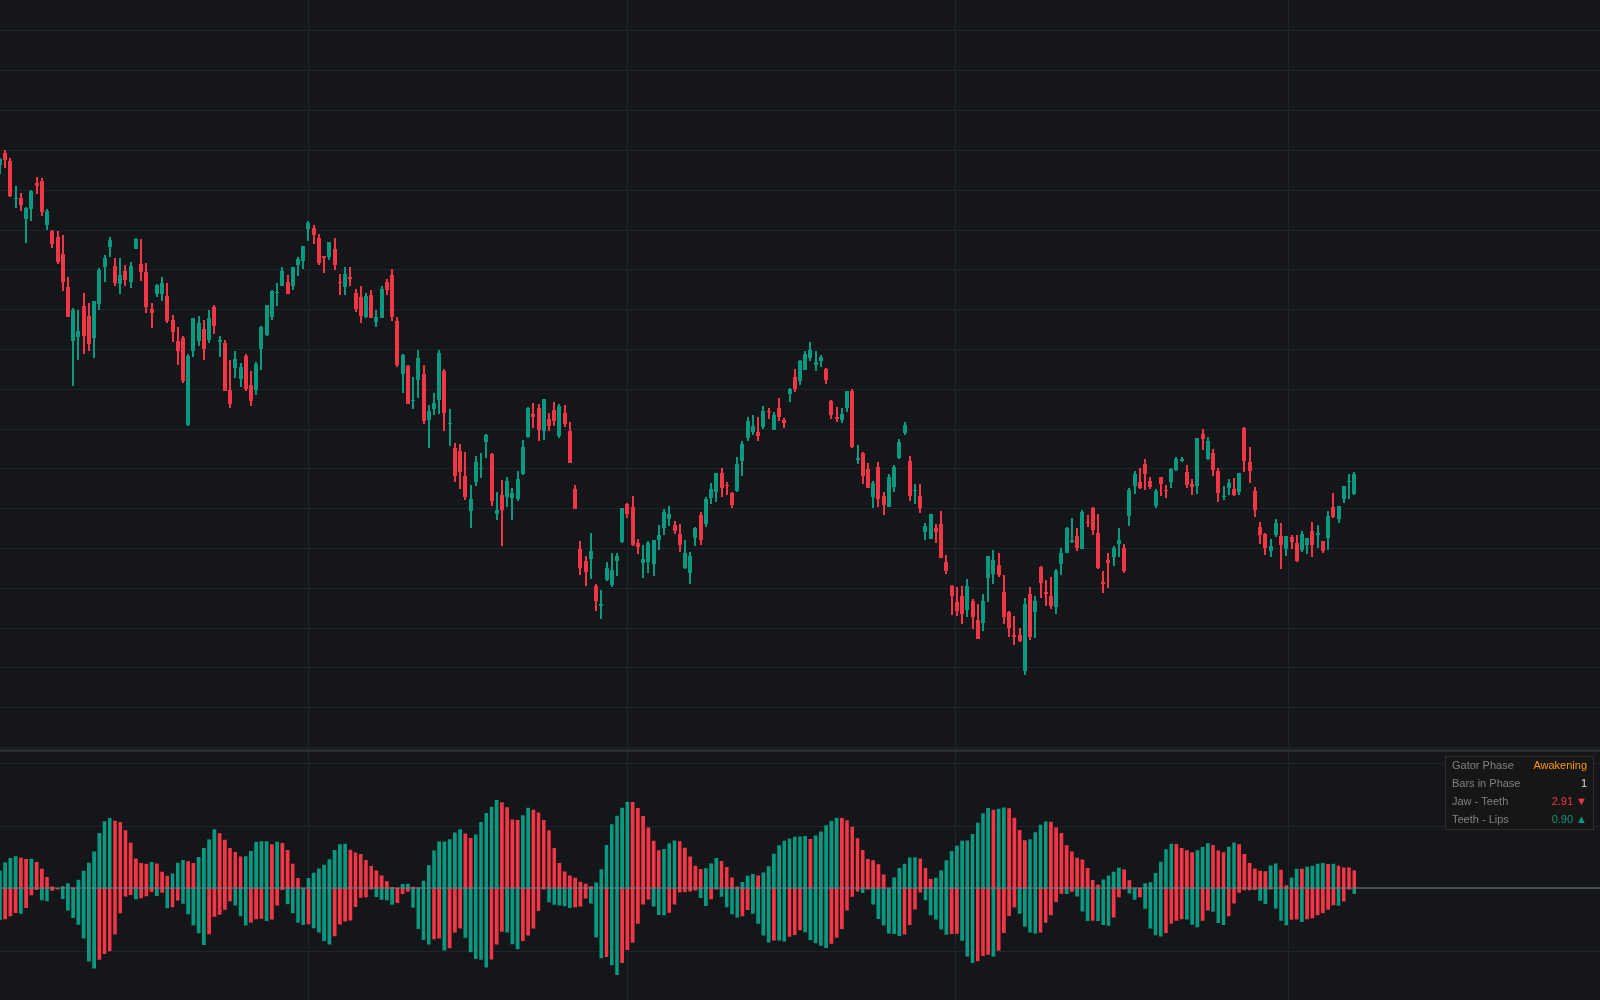

Gator Oscillator re-expresses the Alligator's three displaced averages as two mirrored histograms around zero, the first faithful build of the Gator Oscillator in the library. The Upper Histogram (Jaw - Teeth) plots the absolute spread between the displaced jaw and teeth, the Lower Histogram (Teeth - Lips) mirrors the teeth-lips spread below zero, and each side colors against its own previous bar: green when the spread grew, red when it shrank.
How to Trade the Gator Oscillator?
- Both sides red (Sleeping): both spreads are narrowing at once, a ranging stretch where trend entries are conventionally avoided.
- One side turns green (Awakening): the first sign of separation; direction still has to come from price, since the histograms are unsigned spreads.
- Both sides green (Eating): the trend phase is fully underway.
- One side back to red (Sated): after an eating run, the move may be losing steam, a common cue to tighten stops.
- Deep Sleep: an alert after a configured run of sleeping bars, flagging extended convergence.
All five transitions carry alerts, and the dashboard shows the phase, its age in bars and both spreads.
Gator Oscillator Settings
- Source (default hl2): price series fed to the three averages, median price in the original recipe.
- Smoothing (default SMMA (Wilder)): SMA and EMA substitutes shift the spreads and phases slightly.
- Jaw Length (default 13) with Offset (default 8), Teeth Length (default 8) with Offset (default 5), Lips Length (default 5) with Offset (default 3): the classic lengths and forward displacements.
- Deep Sleep After (bars) (default 10): consecutive sleeping bars before the deep-sleep alert.
- Show Dashboard (default enabled) with Position (default Top Right) and Size (default Small); Phase Background (default disabled) tints the pane by phase.
Frequently Asked Questions

Original indicatorBuilt in-house by LuxAlgo
The Library is free. Quant makes it yours.
Pull any concept or indicator into Quant: rebuild it, retune it, or turn it into a backtested strategy of your own.