Internal Candle Strength
 By LuxAlgoJul 9, 2025
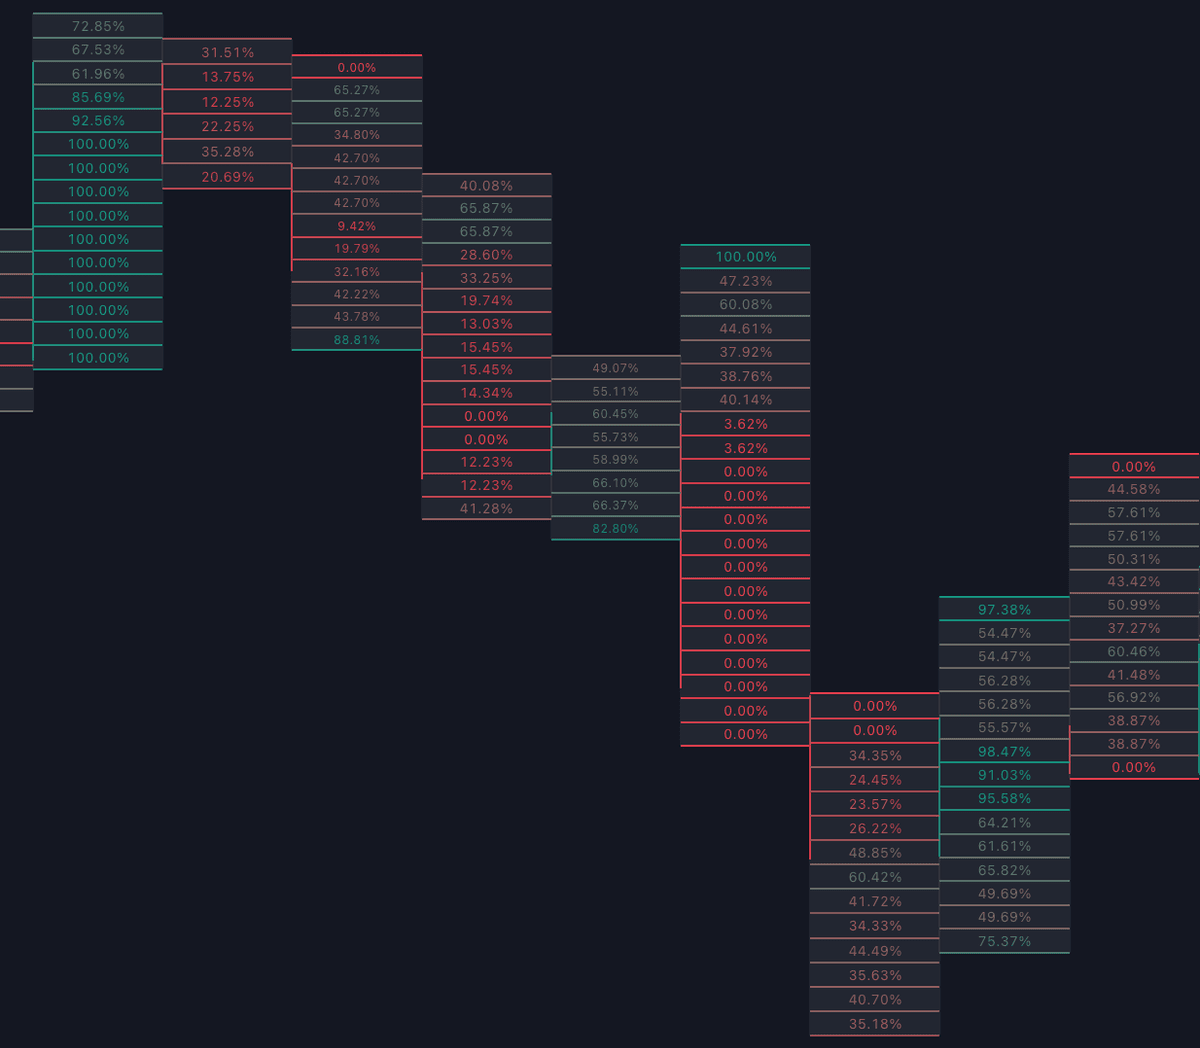

Internal Candle Strength opens up the anatomy of a candlestick, slicing each bar into stacked rows and scoring every row from 0% (strongest bearish) to 100% (strongest bullish) using trend behavior read from a lower timeframe. One close and one color can hide an entire fight; this view shows where inside the bar the balance of power actually tipped.
How to Trade the Internal Candle Strength?
- Rows near 100%: the lower-timeframe trend through that slice of the bar was firmly bullish.
- Rows near 0%: bearish control across that section of the range.
- Sharp shifts at the extremes: sudden strength changes in the top or bottom rows of a bar can flag exhaustion or an approaching reversal.
- Confirmation before entry: check whether a signal candle's internal rows agree with the trade you are about to take.
Feed it intrabar data such as 5-minute rows on a 30-minute chart. The selected timeframe must be lower than the chart's (that is what makes the internal mapping meaningful) and both scalpers and swing traders can tune the resolution to their horizon.
Internal Candle Strength Settings
- Timeframe: the lower timeframe supplying intrabar trend data; always choose one below the chart timeframe.
- Row Size: each row's share of the candle's range. Smaller values mean more rows and finer resolution, larger values mean fewer, broader zones.
Frequently Asked Questions
Free indicator
Get free access to this indicator on the platforms below.

The Library is free. Quant makes it yours.
Pull any concept or indicator into Quant: rebuild it, retune it, or turn it into a backtested strategy of your own.