Concept
Elder Ray
Elder Ray is a Momentum & Oscillators concept. The Library holds 1 implementation, a working definition you can pull into Quant.
bull/bear power
The standard Elder Ray indicator
Elder Ray exactly as classically defined: the faithful reference build of the original formula, free to run in Quant.
What is Elder Ray?
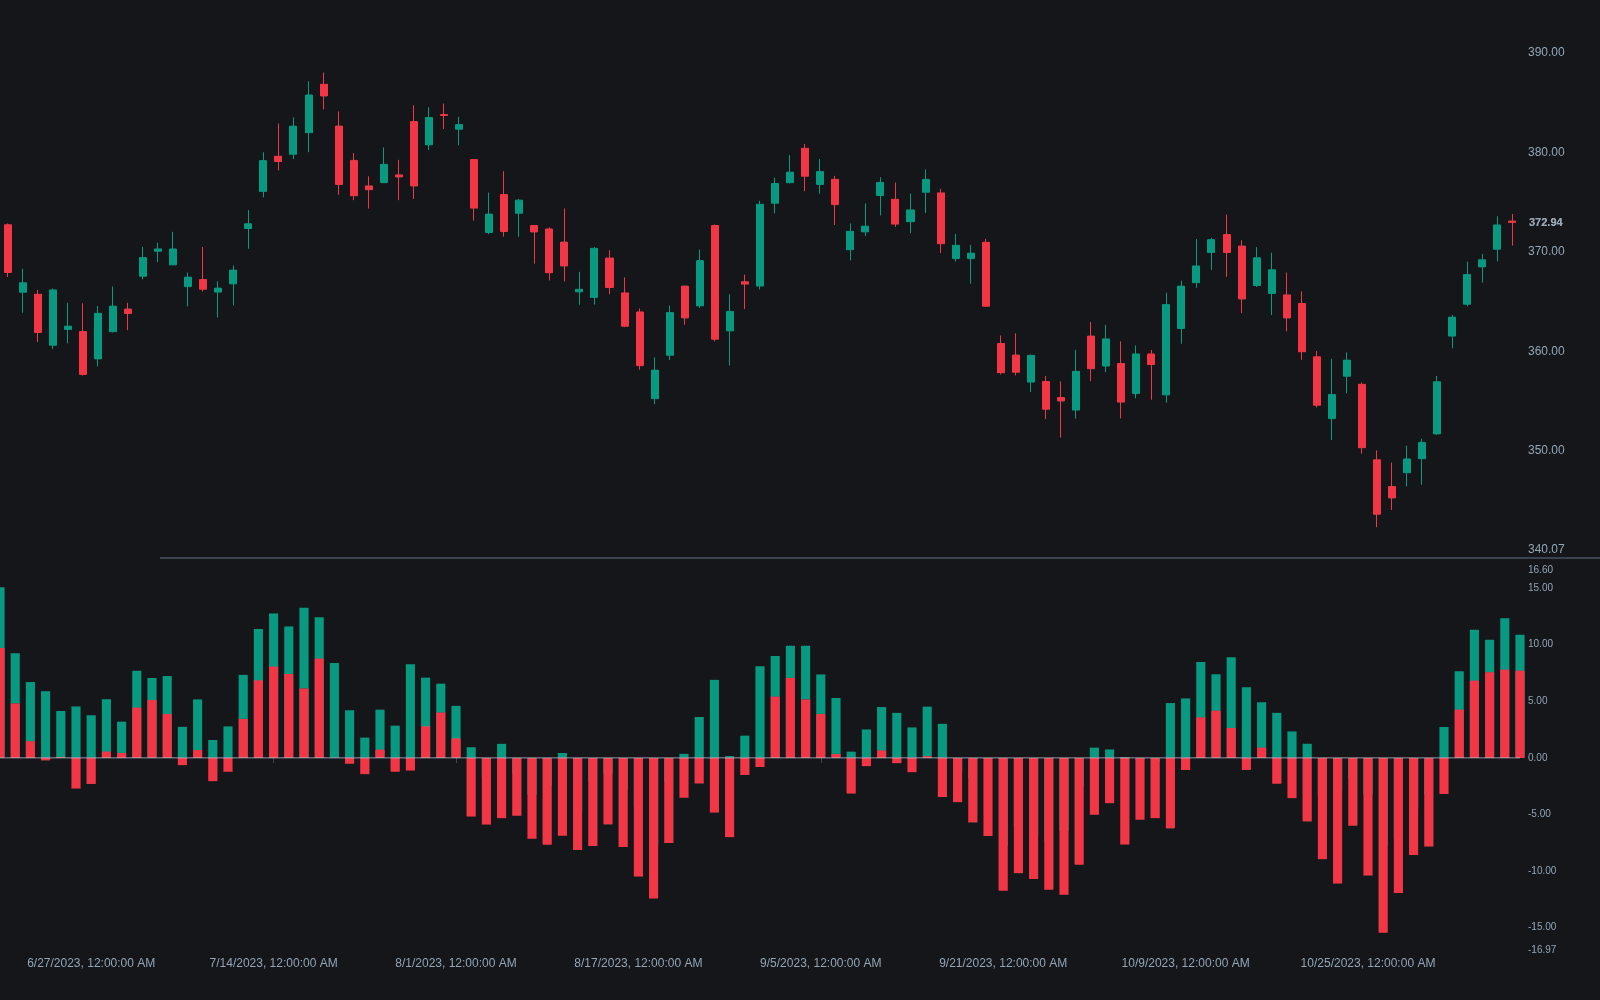
Elder Ray is Alexander Elder's pair of gauges for separating buying and selling pressure around consensus value, introduced in Trading for a Living (1993). With a 13-period EMA standing in for the market's average value, Bull Power is the bar's high minus the EMA and Bear Power is the bar's low minus the EMA. Bull Power measures how far buyers could push price above value during the bar; Bear Power, normally negative, measures how far sellers could drag it below.
The name is Elder's X-ray metaphor: the histograms are meant to reveal the force structure beneath price bars the way a radiograph shows bone beneath tissue. Elder, a psychiatrist by training, framed markets behaviorally, and Elder Ray operationalizes one such claim: the EMA tracks the crowd's consensus of value, while each bar's high and low mark how far buyers and sellers could push away from it before the other side pushed back.
The tool is designed to be asymmetric and trend-gated: the EMA's slope defines the trend, and the two histograms time entries within it. In uptrends the focus is Bear Power, watching for pullbacks that lose their downward force; in downtrends it is Bull Power, watching for rallies that fail at value.
What distinguishes Elder Ray among momentum tools is that it refuses to net the two sides. An RSI or ROC collapses buying and selling into one line; Bull and Bear Power keep them separate, so a single bar can show strong buyers and strong sellers at once (a wide bar spanning the EMA) or neither (a narrow bar hugging it). Divergences between the power series and price are the tool's highest-weight readings, and Elder's published entry rules lean on them explicitly.
How to identify Elder Ray readings on a chart
Elder Ray plots Bull Power and Bear Power as histograms beneath price, typically in two panes, and its readings only make sense relative to the EMA's direction.
- 1Add the Elder Ray indicator: a 13-period EMA on price, Bull Power (high minus EMA) in one pane, Bear Power (low minus EMA) in another.
- 2Establish trend first from the EMA's slope: rising means only long setups are considered, falling means only shorts.
- 3In an uptrend, watch Bear Power: it is normally negative, and the setup forms when it stops making deeper lows and ticks back toward zero during a pullback.
- 4In a downtrend, watch Bull Power: positive spikes that shrink and roll over mark rallies failing at value.
- 5Scan for divergences: price at a new extreme while the relevant power series prints a shallower extreme is the strongest configuration Elder describes.
How it's calculated
Two histograms measuring how far buyers can push the high and sellers can push the low relative to an EMA of closes.
Alexander Elder's default is a 13-period EMA, with the EMA's slope used as the trend filter.
Bull Power above zero means the bar's high sits above the EMA; Bear Power below zero means the low sits below it.
How traders use it
- Buying pullbacks in uptrends: with the EMA rising, a negative Bear Power that stops deepening and ticks up flags sellers weakening; a bullish divergence in Bear Power against a lower price low is the stronger version of the signal.
- Shorting rallies in downtrends: with the EMA falling, a positive Bull Power that rolls over marks buyers failing to sustain price above value, with bearish divergence again the higher-conviction variant.
- Strength checks at new extremes: fresh price highs on weaker Bull Power peaks, or fresh lows on shallower Bear Power troughs, warn the move is being made with less force than the prior push.
- Continuation checks in the spirit of hidden divergence: price holding a higher low while Bear Power prints a deeper low shows sellers spending more force for less price damage, a configuration trend traders read as a buyable dip rather than a forming top.
- Cross-confirmation with a netted gauge: pairing the power histograms with MACD or a stochastic momentum index reading guards against acting on a marginal one-bar tick.
Elder Ray vs other momentum gauges
MACD: MACD measures the spread between two EMAs of the close, a netted momentum-of-consensus reading. Elder Ray measures each bar's high and low against one EMA, preserving the buyer side and the seller side as separate series.
Disparity Index: The disparity index is the close's percentage distance from a moving average, one number per bar. Elder Ray applies the same distance-from-average idea to the bar's extremes instead, splitting it into Bull and Bear components.
RSI: RSI normalizes average gains against average losses into a bounded 0-100 scale, so extremes are comparable across markets. Bull and Bear Power are unbounded price distances, judged against their own recent history rather than fixed thresholds.
Concept family
Momentum & Oscillators
91 concepts mapped · 91 in the Library
Elder Ray FAQ
Turn Elder Ray into a trading strategy.
Take the implementation from this page into Quant, then build on it, backtest it on real data, and keep refining it in conversation.