Traders Dynamic Index
 By LuxAlgoMay 10, 2026
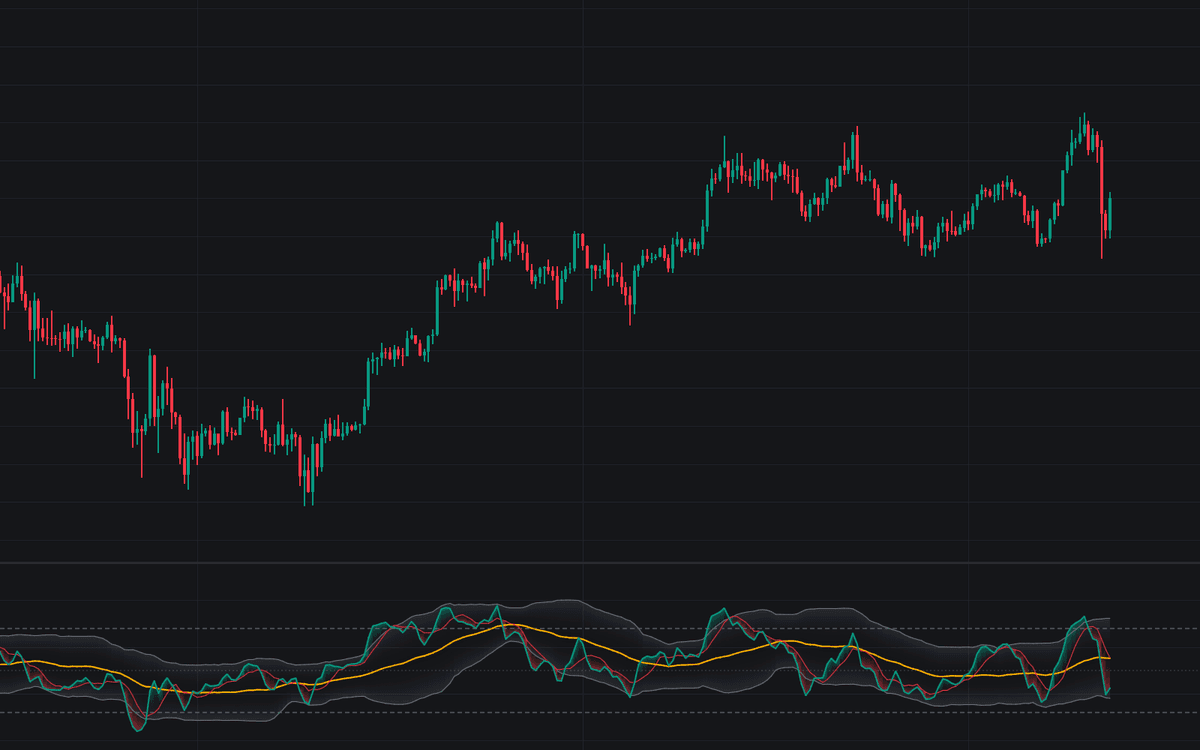

Traders Dynamic Index rebuilds Dean Malone's Traders Dynamic Index, the composite panel that reads one RSI four ways. A fast price line supplies timing, a slower signal line completes the crossover pair, and Bollinger Bands run on the RSI itself wrap momentum in a volatility envelope whose midline, the classic yellow market base line, carries the regime read. Gradient fills show which of the pair is on top and how wide the envelope sits.
How to Trade the Traders Dynamic Index?
- Price line crosses the signal line: the classic TDI cue in either direction; the filtered variants demand both averages on the same side of 50 before counting the cross.
- Market base line versus 50: crossing above shifts the regime bullish, crossing below shifts it bearish, the filter the other reads hang from.
- Price line pressing an outer band: stretched momentum in that direction, while a pinching envelope marks compression that tends to precede a stronger push.
Dashed zone lines at 68 and 32 frame stretched readings, and ten alert conditions cover raw and filtered crossovers, both midline events, both regime shifts and both band presses.
Traders Dynamic Index Settings
- RSI Length (default 13): lookback of the RSI every component derives from.
- Source (default close): series the RSI is computed on. The choice propagates to every line.
- Price Line Length (default 2) and Signal Line Length (default 7): smoothing of the fast and slow lines.
- Bands Length (default 34): basis of the RSI Bollinger Bands and their market base line.
- Bands Multiplier (default 1.6185): standard deviations between the base line and each band.
- Overbought (default 68) and Oversold (default 32): the zone lines.
- Style toggles cover the crossover fill, the bands fill and optional crossover markers.
Frequently Asked Questions

The Library is free. Quant makes it yours.
Pull any concept or indicator into Quant: rebuild it, retune it, or turn it into a backtested strategy of your own.