5/35 Oscillator
 By LuxAlgoApr 30, 2026
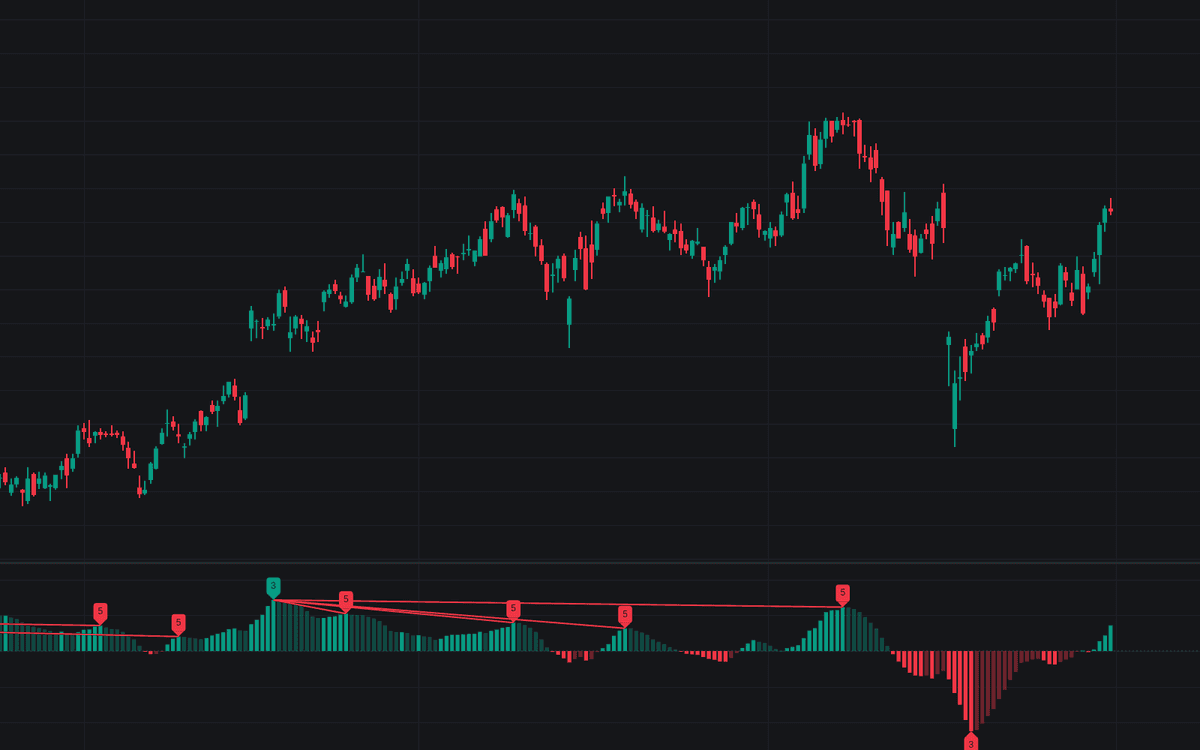

5/35 Oscillator plots the gap between 5-period and 35-period simple moving averages as a zero-centered histogram, then layers on the wave-context reads that made the 5/35 oscillator a fixture of computerized Elliott work. Columns carry a four-state color (bullish or bearish, growing or fading) so acceleration shows at a glance, and confirmed extremes can be tagged with the traditional 3 and 5 reads, the latter drawn with a divergence line back to the peak it diverges from.
How to Trade the 5/35 Oscillator?
- Zero cross: a sign flip means the short average has crossed the long one, a bias change; within an active count, a return toward zero is the classic fourth-wave signature.
- 3 read: a confirmed extreme beyond the sequence's running extreme. The tradition treats that push as still wave 3, arguing against calling the top early.
- 5 read: price at a fresh extreme while the histogram posts a smaller peak, the traditional fifth-wave divergence warning of completion.
Reads confirm Peak Confirmation Length bars after the actual extreme and do not repaint once drawn. Treat them as guidelines with exceptions, not a wave count.
5/35 Oscillator Settings
- Source (default close): series both averages use; hl2 gives an Awesome-Oscillator-style construction.
- Fast SMA Length (default 5): the short average tracking the swing in progress.
- Slow SMA Length (default 35): the long average standing in for the next degree of trend.
- Show Wave Reads (default on): toggles the 3 and 5 tags at confirmed extremes.
- Peak Confirmation Length (default 5): bars without a more extreme reading required on each side before a peak counts.
- Max Bars Between Peaks (default 150): extremes further apart start a new sequence instead of being compared.
Frequently Asked Questions

The Library is free. Quant makes it yours.
Pull any concept or indicator into Quant: rebuild it, retune it, or turn it into a backtested strategy of your own.