All indicators

EQH/EQL Liquidity Zones

By LuxAlgoApr 13, 2026

Static chart image
Price Action BasedSupport and ResistanceLiquidity

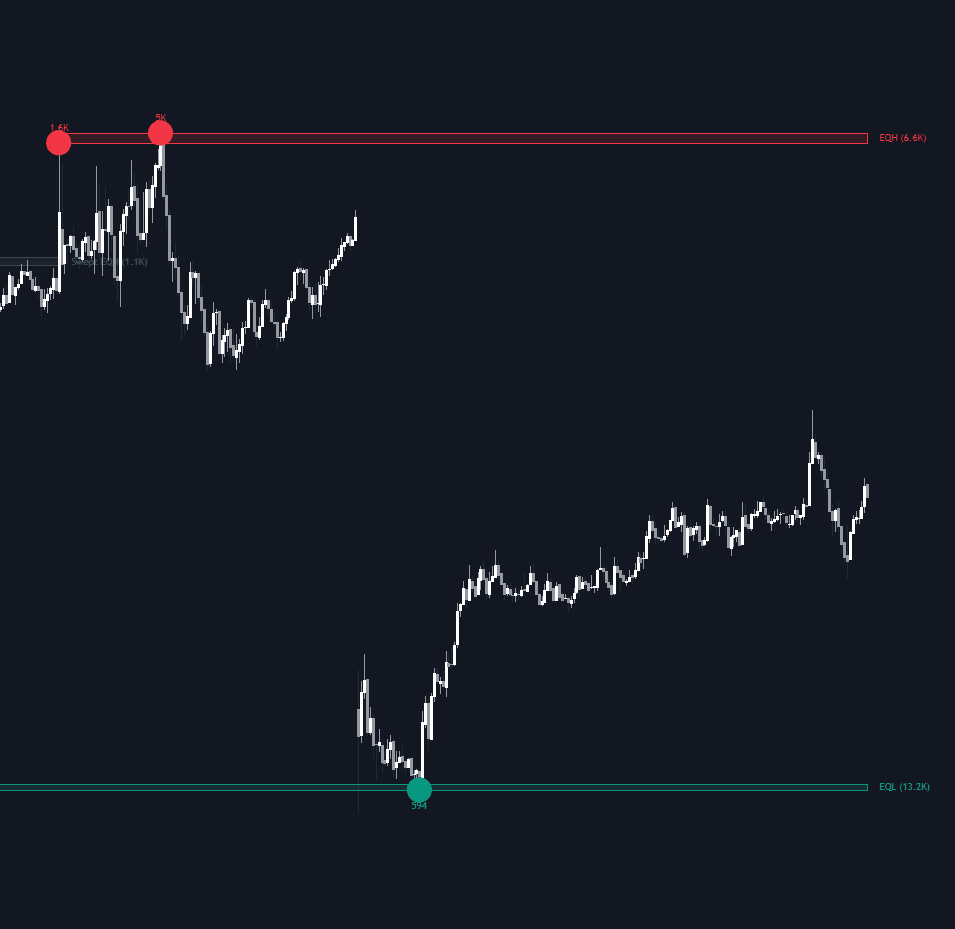
The EQH/EQL Liquidity Zones trading indicator automatically detects Equal Highs (EQH) and Equal Lows (EQL) to help traders map liquidity zones, spot likely stop-hunt areas, and anticipate where price may be drawn next. By turning repeated highs and lows into clean visual zones, this tool gives traders a practical way to analyze resting liquidity, identify potential sweep targets, and better understand how price reacts around key support and resistance structures.

How to Trade the EQH/EQL Liquidity Zones Indicator

Equal Highs and Equal Lows are widely used in price action trading and Smart Money Concepts (SMC) because they often reveal where liquidity is concentrated. When price prints two or more highs or lows at nearly the same level, traders often place stop-loss orders just beyond those levels. This creates a pool of resting liquidity that the market may later target.

The EQH/EQL Liquidity Zones indicator helps visualize those areas automatically. Instead of manually marking every repeated high and low, the script scans price structure, detects qualifying liquidity patterns, and extends them into active zones until price eventually sweeps them.

For traders using this as part of a broader trading strategy, EQH zones can act as upside liquidity targets above resistance, while EQL zones can act as downside liquidity targets below support. This makes the indicator useful for breakout traders, reversal traders, and anyone looking to understand where price may seek liquidity before making its next major move.

How the Indicator Identifies Liquidity

The script analyzes confirmed pivot highs and pivot lows, then compares them using a user-defined equality threshold. When two pivots form at approximately the same price, the indicator classifies them as Equal Highs or Equal Lows and creates a liquidity zone.

These zones begin at the original pivot structure and remain active until price moves through them. This allows traders to track unswept liquidity in real time and keep an eye on levels that may attract future price action.

Because markets rarely print perfectly identical highs and lows down to the exact tick, the equality threshold is important. It gives the indicator flexibility to capture realistic EQH and EQL formations that would otherwise be missed by an overly strict approach.

Volume and Liquidity Clusters

A major strength of this trading indicator is that it does more than just mark structure. It also displays the volume tied to the pivot points that created the liquidity zone, giving traders extra context about how meaningful that zone may be.

If several liquidity zones form close together, the script can merge their labels into a cluster display such as 2x EQH or 3x EQL. It also sums the related pivot volume at that area. This helps traders quickly identify zones where liquidity may be especially dense.

In practice, clustered liquidity can be more significant than a single isolated EQH or EQL. These areas may serve as stronger targets for price, especially during volatile sessions or when the market is searching for stops before reversing or accelerating.

How Sweep Behavior Works

Once price trades above the highest point of an EQH zone or below the lowest point of an EQL zone, that zone is considered swept. This is an important part of liquidity-based trading, because many traders look for these sweeps as confirmation of stop-runs, false breakouts, or market manipulation around obvious structural levels.

The indicator gives you flexibility in how these swept zones are handled. You can remove them immediately once the sweep happens, or keep them visible on the chart in a faded style. Keeping swept zones visible can be useful for studying historical reactions and understanding how price behaved after liquidity was taken.

For many traders, this makes the tool valuable not just for live setups, but also for chart review and strategy development.

Indicator Logic and Detection Method

The EQH/EQL Liquidity Zones indicator uses a pivot-based structure engine combined with a percentage-based comparison model. This allows it to classify highs and lows as “equal” even when price is only approximately aligned rather than perfectly identical.

This matters because real-market liquidity rarely forms with exact precision. By allowing a small tolerance, the indicator reflects how traders actually interpret equal highs and equal lows on a chart.

The script also manages active liquidity zones up to a configurable limit. This is especially useful on lower timeframes or in fast-moving markets, where multiple unswept zones can exist at once. Increasing the number of active zones can help traders maintain a fuller liquidity map during busy sessions.

Why Traders Use EQH/EQL Liquidity Zones

This trading indicator can support several different trading styles:

  • Liquidity targeting: Identify likely destinations for price as it seeks resting stops above highs or below lows.
  • Reversal trading: Watch for liquidity sweeps followed by rejection to catch potential turning points.
  • Breakout filtering: Distinguish between a true breakout and a temporary sweep of equal highs or equal lows.
  • Market structure analysis: Add objective liquidity mapping to support and resistance study.
  • SMC trading strategies: Integrate EQH and EQL detection into broader Smart Money Concepts workflows.

Because the indicator simplifies one of the most common liquidity concepts in technical analysis, it can be useful for newer traders learning market structure as well as advanced traders building more detailed liquidity-based trading strategies.

SETTINGS

Liquidity Detection

  • Pivot Left/Right Length: Determines how many bars are needed on each side to confirm a structural pivot high or low.
  • Equality Threshold (%): Sets the maximum percentage difference allowed between pivots for them to qualify as Equal Highs or Equal Lows.
  • Max Active Zones: Defines how many unswept liquidity zones the indicator can track at the same time.

Visual Customization

  • Bullish/Bearish Zone Color: Sets the colors used for EQL and EQH liquidity zones.
  • Zone Transparency: Adjusts how visible or subtle the liquidity boxes appear on the chart.
  • Show Midline: Displays a dashed average line inside the zone to mark the midpoint of the equal pivots.
  • Show Volume: Toggles the display of volume associated with the pivots forming the liquidity.
  • Delete on Sweep: Removes the zone immediately after price sweeps it, instead of keeping it visible in a faded historical state.

FAQ

What is the EQH/EQL Liquidity Zones indicator?

It is a liquidity-based trading indicator that automatically detects Equal Highs and Equal Lows, draws them as active zones, and tracks whether price has swept those areas. It is designed to help traders identify stop-loss liquidity, likely price targets, and important market structure levels.

How do traders use Equal Highs and Equal Lows in a trading strategy?

Traders use EQH and EQL levels to find areas where resting liquidity may be sitting. These zones can be used as targets, reversal areas, confirmation points, or part of a Smart Money Concepts trading strategy built around liquidity sweeps and market structure shifts.

Why is volume shown on liquidity zones?

Volume gives extra context about how meaningful the pivot formation may be. A liquidity zone formed with stronger participation can stand out more than one created with light activity, helping traders prioritize the most relevant areas.

What does it mean when a liquidity zone is swept?

A sweep happens when price moves above an EQH zone or below an EQL zone and takes the liquidity resting beyond that level. Traders often watch for sweeps because they can signal either breakout continuation or a stop-run that leads into reversal.

How do I access the EQH/EQL Liquidity Zones indicator?

You can get access on the LuxAlgo Library for charting platforms like TradingView, MetaTrader (MT4/MT5), and NinjaTrader.

Free indicator

Get free access to this indicator on the platforms below.

TradingView
NinjaTrader
MetaTrader 4/5

Unlock the entire LuxAlgo Library

Every indicator, every strategy, full charts, and complete access to Quant — our AI agent.