Fibonacci Ranges (Real-Time)
 By LuxAlgoSep 19, 2023
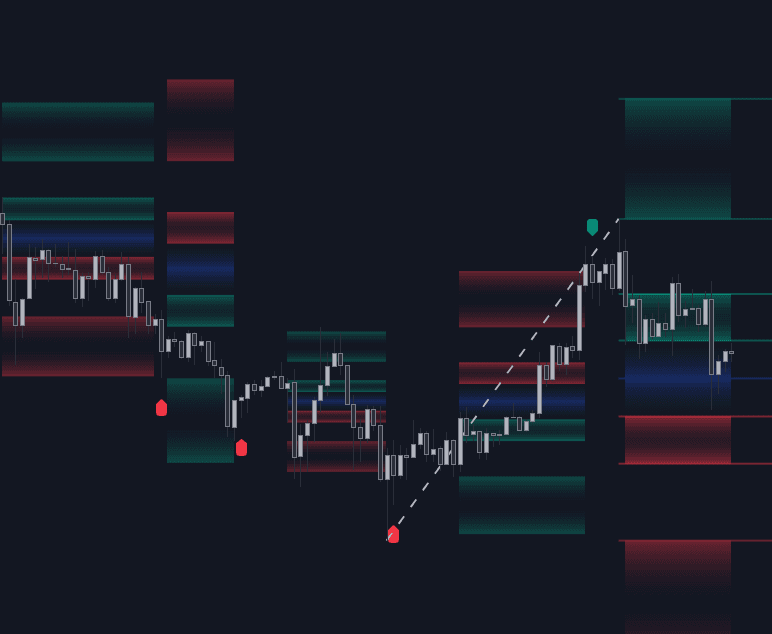
Fibonacci Ranges (Real-Time) wraps the latest swing high and low in Fibonacci retracements and keeps the resulting channel live while the market negotiates it. A channel is born when a fresh swing forms and price closes inside the chosen break levels; it survives until a set number of consecutive bars close beyond them. Every visible range is therefore one price still respects, a rolling map of the active trading range.
How to Trade the Fibonacci Ranges (Real-Time)?
- Range extremities: the outer areas of each channel serve as support and resistance for trades within the range.
- Breakout labels: when price escapes a channel, the indicator flags a possible reversal, the point where ranging logic hands over to directional logic.
- Failed escapes: if price closes back inside the break levels before the count completes, the breakout count resets to zero, often a sign the range still holds.
- Shadows: prior channels drawn with a one-bar delay; where large shadow blocks stack, durable support and resistance regions tend to sit.
- Latest Fibonacci: an independent set of levels spanning the newest swing high and low, useful for reading the current directional context.
Fibonacci Ranges (Real-Time) Settings
- L / R: bars required to the left and right to confirm a swing point.
- Channel: choose Channel, Channels + Shadows, or None.
- Break level: the level pair that defines escape: 0.382-1.382, 0.000-1.000, 0.236-0.764, or 0.382-0.618. Narrower pairs retire channels sooner; broader pairs create larger, more frequent ones.
- Break count: consecutive closes outside the break levels needed to end a channel.
- Show breaks: marks each break instance; alerts are available for Break Up and Break Down events.
Frequently Asked Questions
Free indicator
Get free access to this indicator on the platforms below.
TradingView
NinjaTrader
MetaTrader 4/5

Original indicatorBuilt in-house by LuxAlgo
The Library is free. Quant makes it yours.
Pull any concept or indicator into Quant: rebuild it, retune it, or turn it into a backtested strategy of your own.