All indicators

Hot Zone Radar

By LuxAlgoFeb 19, 2026

Static chart image
DashboardVolatility

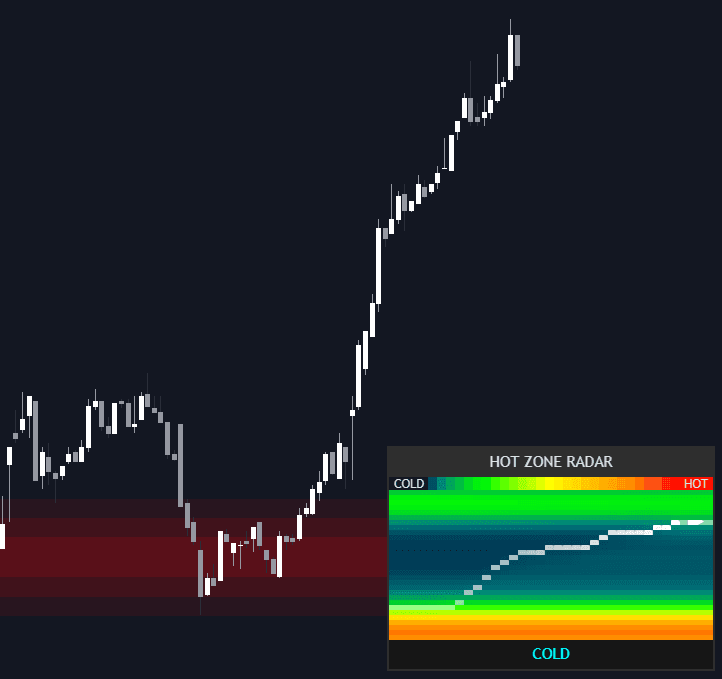
The Hot Zone Radar indicator is an advanced trading indicator designed to visualize market liquidity in real time using a dynamic heatmap dashboard and projected gradient support and resistance zones. By transforming raw volume data into a thermal “weather map” of price density, this tool helps traders identify high-liquidity friction zones and low-liquidity breakout areas, making it ideal for both trend-following and mean-reversion trading strategies.

How to Trade the Hot Zone Radar Trading Indicator?

The Hot Zone Radar combines two powerful components into a single liquidity-driven trading system:

  • A dynamic Radar Dashboard that tracks evolving volume distribution.
  • On-chart Gradient Support & Resistance Zones that highlight actionable price levels.

This dual-structure makes it more than a standard volume profile. It becomes a complete trading strategy framework for identifying liquidity clusters, breakout zones, and institutional supply/demand areas.


The Radar Dashboard

The Radar Dashboard acts as a rolling, high-resolution volume heatmap that shifts over time. Unlike static volume profile tools, this trading indicator continuously updates its internal liquidity matrix, allowing traders to see how volume nodes evolve.

Price Trace & Current Position

  • The current price is plotted directly onto the heatmap using marker dots (●) and a final pointer (▶).
  • This overlay shows precisely where price sits relative to historical High-Volume Nodes (HVNs) and Low-Volume Nodes (LVNs).
  • Traders can instantly evaluate whether price is approaching resistance, sitting in consolidation, or moving through a liquidity void.

Thermal Color Scale

The heatmap uses a gradient-mapped color model:

  • Deep Blue / Cyan → Cold Zones (Low Liquidity)
  • Bright Red → Hot Zones (High Liquidity)

This color transition makes it easy to visually identify:

  • Liquidity hubs (potential consolidation or reversal zones)
  • Liquidity vacuums (potential breakout acceleration areas)

Market Status Indicator

A simplified market status bar provides immediate context for your trading strategy:

  • HOT: Price is oscillating inside a major liquidity hub (range-bound conditions likely).
  • WARM: Price is trending toward a high-volume cluster (potential magnet effect).
  • COLD: Price is inside a low-volume vacuum (momentum breakouts possible).
  • STABLE: Neutral volume conditions.

This classification helps traders quickly adapt their approach between breakout trading and mean-reversion trading.


On-Chart Gradient Support & Resistance Zones

Beyond the dashboard, the indicator automatically extracts the most significant liquidity clusters and projects them directly onto the price chart as gradient-filled boxes.

These dynamic zones:

  • Represent high-volume institutional areas.
  • Act as adaptive support and resistance levels.
  • Highlight areas of likely reaction, consolidation, or rejection.

When price enters a zone:

  • The gradient shifts to indicate active interaction.
  • Traders can anticipate potential reversals or compression before a breakout.
  • Scalpers and swing traders can refine entry and exit timing.

This feature transforms the Hot Zone Radar from a visualization tool into a complete liquidity-based trading system.

Indicator Details & Internal Logic

The Hot Zone Radar is powered by a rolling Volume Profile engine feeding into a 2D historical matrix.

Thermal Data Engine

At its core, the indicator:

  1. Calculates volume distribution across a user-defined price range.
  2. Divides the range into vertical resolution bins.
  3. Updates the matrix as each new bar forms.
  4. Ages out old data to maintain a rolling liquidity history.

This creates the signature horizontal “flow” of the radar, showing not just where volume exists — but how long it has persisted.

This time-weighted liquidity insight is critical for:

  • Identifying strong structural support and resistance.
  • Spotting newly forming liquidity nodes.
  • Detecting weakening zones before they break.

Diffusion Blur Algorithm

To improve clarity and usability, a Diffusion Blur algorithm smooths raw volume spikes into cohesive thermal structures.

Benefits include:

  • Clearer visualization of major liquidity clouds.
  • Reduced noise from minor spikes.
  • Better identification of structurally important zones.

This smoothing enhances both aesthetics and trading decision accuracy.

Settings & Customization

The Hot Zone Radar trading indicator includes extensive configuration options for different trading styles, timeframes, and assets.

Radar Logic

  • Profile Lookback: Number of historical bars used to compute volume distribution.
  • Resolution (Heatmap Grid): Controls vertical bins and horizontal steps. Higher resolution = more detail, higher processing cost.
  • Diffusion Blur: Adjusts smoothing intensity.
  • Intensity Gamma: Controls color sensitivity. Lower values make “Hot” zones appear more frequently.

These settings allow traders to fine-tune the indicator for scalping, intraday trading, or swing trading.

Support/Resistance Zones

  • Show Gradient S/R Zones: Enable or disable projected liquidity boxes.
  • S/R Sensitivity %: Sets the volume threshold required to display a zone. Higher values filter for only the strongest liquidity hubs.
  • Gradient Steps: Controls the layered glow effect for visual emphasis.

Higher sensitivity settings are ideal for longer-term structural trading, while lower thresholds suit short-term breakout strategies.

Dashboard Styling

  • Position: Top Right, Bottom Right, or Bottom Left.
  • Overall Panel Size: Scale the dashboard UI for your screen resolution.

This ensures the tool integrates seamlessly into your existing trading workflow.

Why Use the Hot Zone Radar in Your Trading Strategy?

The Hot Zone Radar stands out among trading indicators because it:

  • Combines volume profile logic with historical liquidity evolution.
  • Provides actionable on-chart support and resistance zones.
  • Distinguishes between consolidation zones and breakout vacuums.
  • Works across stocks, crypto, forex, futures, and indices.
  • Supports both trend-following and mean-reversion trading strategies.

By understanding where liquidity accumulates — and where it disappears — traders gain a structural edge in anticipating market behavior.


FAQ

What is the Hot Zone Radar trading indicator?

It is a liquidity-based trading indicator that visualizes evolving volume distribution as a dynamic heatmap and projects significant high-volume zones as gradient support and resistance areas on the chart.

How does it help with breakout trading?

When price moves into “Cold” low-volume zones, the indicator highlights liquidity vacuums that often allow faster, momentum-driven breakouts.

Is this indicator suitable for scalping and swing trading?

Yes. By adjusting the lookback, resolution, and sensitivity settings, the Hot Zone Radar can be optimized for short-term scalping or longer-term structural swing trading strategies.

How do I access the Hot Zone Radar?

You can get access on the LuxAlgo Library for charting platforms like TradingView, MetaTrader (MT4/MT5), and NinjaTrader for free.

Free indicator

Get free access to this indicator on the platforms below.

TradingView
NinjaTrader
MetaTrader 4/5

Unlock the entire LuxAlgo Library

Every indicator, every strategy, full charts, and complete access to Quant — our AI agent.