Klinger Oscillator
 By LuxAlgoApr 13, 2020
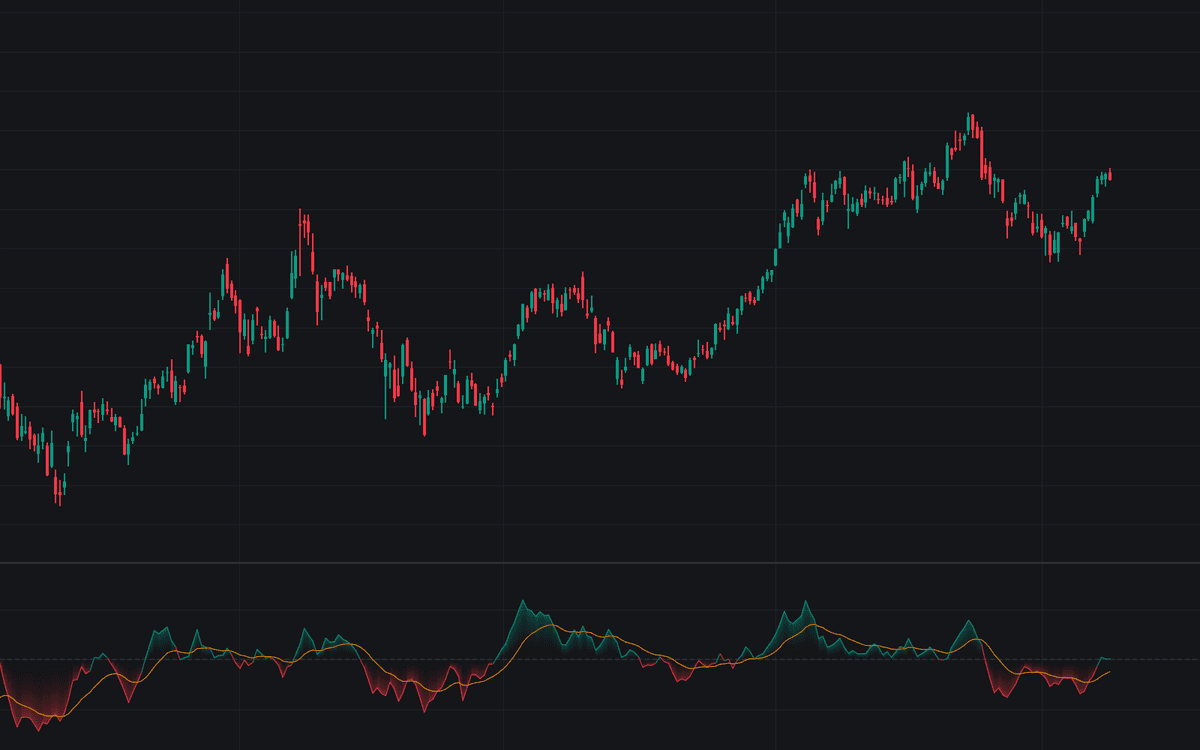

The Klinger Oscillator converts each bar's volume into a signed volume force and plots the difference between the 34-period and 55-period EMAs of that force, with a 13-period EMA signal line for crossover reference. Readings above zero and rising suggest the advance is carried by volume; an oscillator sagging under rising price warns that participation is thinning.
Per bar, the script compares the sum of high, low, and close against the prior bar to fix the trend sign, then scales volume by how the bar's range relates to the cumulative range of the current move. The KVO and Signal lines plot around a dashed zero line, the standard implementation with its classic 34/55/13 defaults.
How to Trade the Klinger Oscillator?
- KVO crossing above the Signal line: volume force improving faster than its recent trend, the conventional bullish trigger.
- KVO crossing below the Signal line: the bearish counterpart, marking deteriorating volume flow.
- Zero-line position: above zero the fast EMA of volume force exceeds the slow one, framing the move as volume-supported.
- Divergence with price: a falling KVO against rising price questions the advance; the reverse questions a decline.
Klinger Oscillator Settings
- Fast Length (default 34): fast EMA applied to the volume force. Shorter registers flow shifts sooner but whipsaws more.
- Slow Length (default 55): slow EMA anchoring the oscillator to the larger accumulation and distribution arc.
- Signal Length (default 13): EMA applied to the oscillator to obtain the Signal line.
Alerts
Four alert conditions are declared: Bullish Signal Cross and Bearish Signal Cross when the KVO crosses above or below its signal line, plus Bullish Zero Cross and Bearish Zero Cross on zero-line crossings.
Frequently Asked Questions

The Library is free. Quant makes it yours.
Pull any concept or indicator into Quant: rebuild it, retune it, or turn it into a backtested strategy of your own.