Trade Volume Index
 By LuxAlgoJul 3, 2026
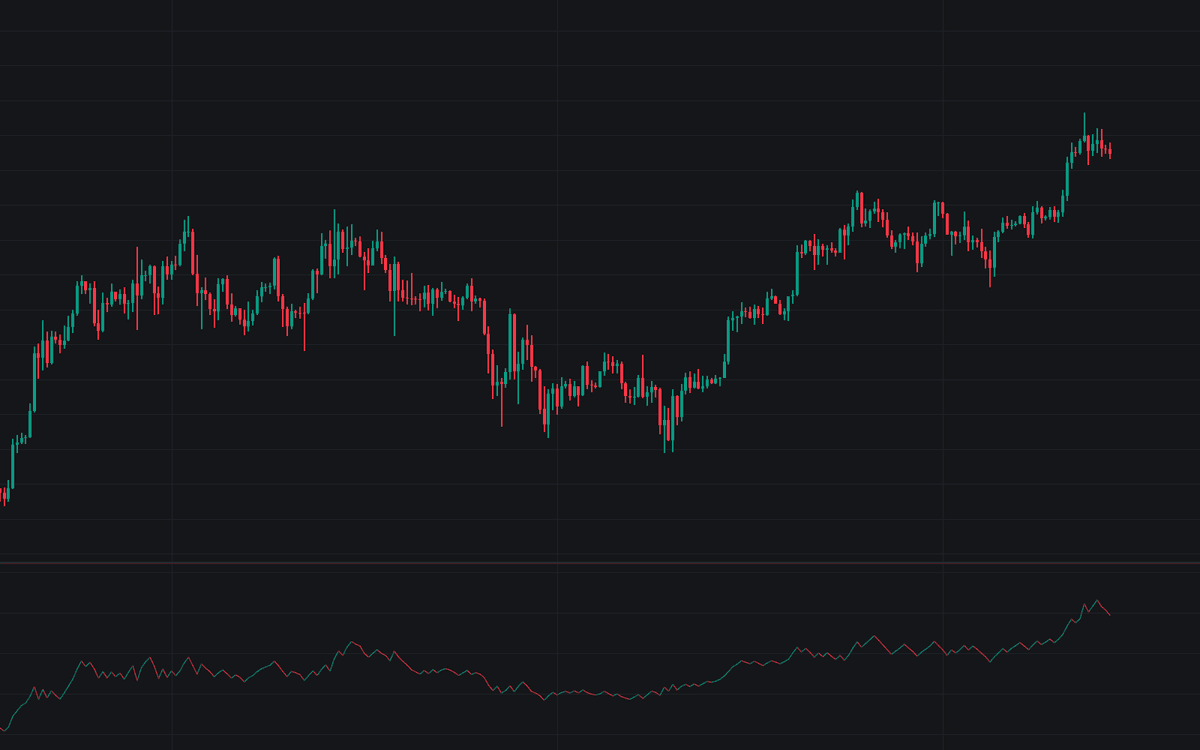

Trade Volume Index accumulates volume print by print, adding it when a price change clears the minimum tick value to the upside and subtracting when it clears it to the downside, the first faithful chart build of the Trade Volume Index. Moves that stay inside the threshold keep the prior qualifying direction, so steady trading at one price keeps crediting the side that got it there. The line is colored by its live classification, with extreme checks and a flat-market read layered on top.
How to Trade the Trade Volume Index?
- Non-confirmation: price takes out its 20-bar extreme but TVI cannot take out its own. Circles mark the bar when enabled, alerts fire regardless.
- Confirmed Upside Breakout: price and TVI make new highs together, qualifying the push with buy-side volume.
- Quiet accumulation/distribution: with price's range under the flat threshold, a rising TVI shades the pane bullish and a falling one bearish, the classic pre-markup and pre-markdown reads.
Trade Volume Index Settings
- Minimum Tick Value (default 0): the move a print must clear to count as directional; 0 uses the instrument tick size, larger values latch the direction longer.
- Granularity (default Chart Bars): applies the rule to bar closes, or to intrabar closes via Lower Timeframe (Intrabars) to approximate the tick data TVI was designed for.
- Lower Timeframe (default 1): intrabar resolution for that mode; bars without coverage fall back to chart bars.
- Extreme Lookback (default 20): window defining new price and TVI extremes.
- Flat Market Lookback (default 20) and Flat Market Range % (default 2): window and maximum range, as a percent of the average close, for price to count as flat.
- Style: Non-Confirmation Markers (off) and Quiet Accumulation/Distribution Highlight (on).
Frequently Asked Questions

Original indicatorBuilt in-house by LuxAlgo
The Library is free. Quant makes it yours.
Pull any concept or indicator into Quant: rebuild it, retune it, or turn it into a backtested strategy of your own.