Impulse MACD
 By LuxAlgoJun 5, 2026
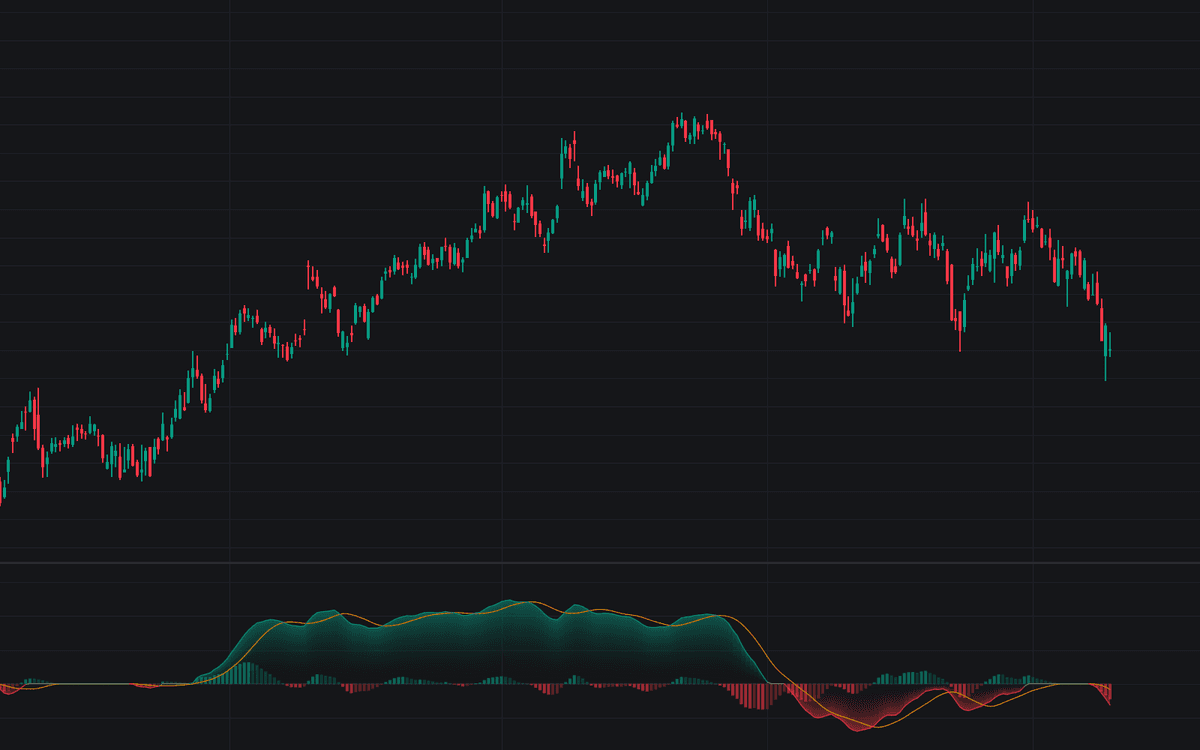

Impulse MACD is a momentum oscillator with the range filter built in: it flatlines at exactly zero while a zero-lag average of price holds within its smoothed high/low band, registering only once price escapes that range. The build keeps the published Impulse MACD construction intact: smoothed averages of the highs and lows form the band, a zero-lag EMA of typical price tracks against it, and the displacement beyond the band becomes the impulse line, topped by a signal line and histogram.
How to Trade the Impulse MACD?
- Ignition: the first print off zero marks price escaping its smoothed range, the event this tool isolates, with alerts both ways.
- Signal cross outside the dead zone: the impulse line crossing its signal line reads as momentum turning, but only while the line is active.
- Histogram shading: bright columns mark expanding momentum, faded columns a histogram already contracting toward its signal line.
- Return to zero: the escape is over and price is back inside its smoothed range. The tool's advice is to stand aside.
Within the momentum family this is the selective member: it gives up continuous readings in exchange for silence while the market ranges.
Impulse MACD Settings
- Source (default hlc3): the series tracked against the band; the published construction uses typical price.
- Length (default 34): bars for the smoothed high/low band and the zero-lag average. Lengthening widens the dead zone.
- Signal Length (default 9): the simple moving average of the impulse line; the histogram measures the gap between the two.
- Style toggles: Show Histogram (default enabled), Gradient Fill (default enabled), Highlight Dead Zone (default disabled), Ignition Markers (default disabled), and Show Band on Chart (default disabled).
Frequently Asked Questions

The Library is free. Quant makes it yours.
Pull any concept or indicator into Quant: rebuild it, retune it, or turn it into a backtested strategy of your own.