Market Sentiment Technicals
 By LuxAlgoJun 11, 2024
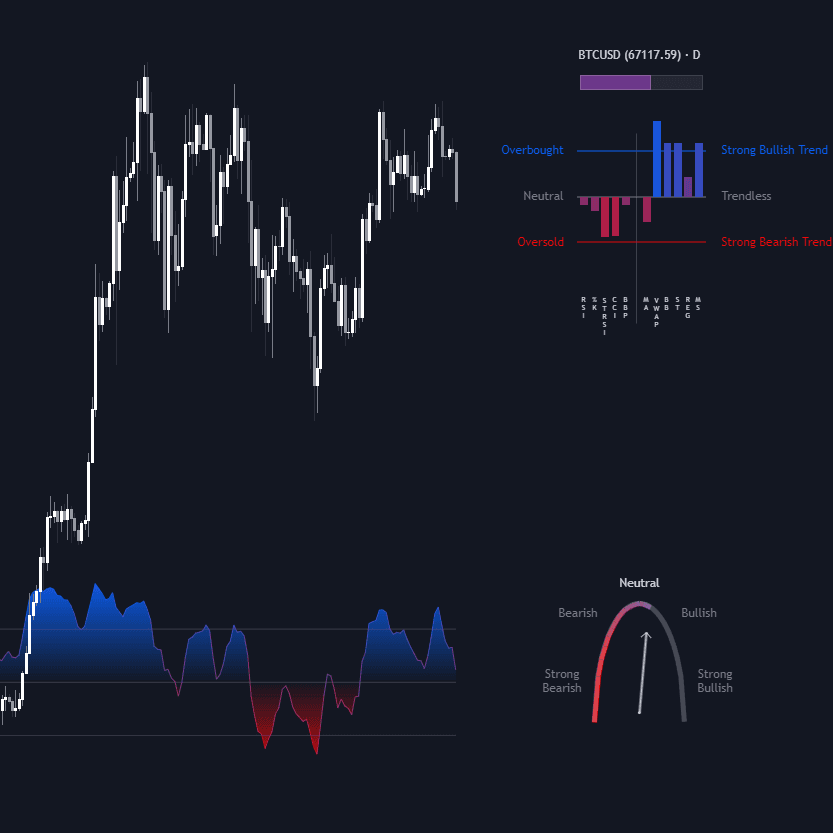
Market Sentiment Technicals answers a single question: what does the weight of the technical evidence say? It normalizes and averages momentum oscillators (RSI, Stochastic %K, Stochastic RSI Fast, CCI, Bull Bear Power), trend tools (moving averages, Bollinger Bands, Supertrend, linear regression), and price action market structures into one sentiment value — confluence scoring in indicator form. Three displays carry the result: a per-component histogram panel, a sentiment meter, and an oscillator.
How to Trade the Market Sentiment Technicals?
- Histogram panel: normalized sentiment per component plus their synthesized average — see which techniques agree and which dissent.
- Sentiment meter: the averaged reading condensed into a quick bullish, sideways, or bearish verdict.
- Oscillator extremes: current and historical strength expose overbought and oversold conditions before potential reversals.
- Divergence: price action that fails to match the oscillator flags a possible trend change.
Trend components are normalized from their own buy and sell signals: price is tracked against the extremes set since the last flip, then smoothed by an adjustable simple moving average of 3 periods.
Market Sentiment Technicals Settings
- Timeframe: the timeframe sentiment is calculated on; lower selections revert to the chart's own.
- Horizontal Offset: distance of the visual components from the main chart.
- Indicators Sentiment Panel, Market Sentiment Meter, Market Sentiment Oscillator: independent visibility toggles, refined by Panel Height, Oscillator Height, Oscillator Line Width, and Show Divergence.
- Source, Length, Smoothing: per-component calculation inputs, plus a dedicated normalization Smoothing for the trend indicators.
Frequently Asked Questions
Why aggregate instead of reading each indicator separately?
A composite reading filters the noise of any single input while the histogram panel keeps every component auditable. Mind the limits, though: it is built from historical price data, and news or macro shocks can override what the technicals suggest.
Can the sentiment be displayed differently?
Each display toggles independently — run just the meter, the oscillator alone, or the full stack. For a radial alternative, a circular barplot of oscillator sentiment presents a similar read in a different shape.
What does it cost to use Market Sentiment Technicals?
Nothing — it's a free LuxAlgo Library indicator available from this page. Quant, LuxAlgo's AI, can run and backtest it right here as well.
Free indicator
Get free access to this indicator on the platforms below.

The Library is free. Quant makes it yours.
Pull any concept or indicator into Quant: rebuild it, retune it, or turn it into a backtested strategy of your own.