Concept
Dominant-cycle Detection
Dominant-cycle Detection is a Time, Sessions & Seasonality concept. The Library holds 1 implementation, a working definition you can pull into Quant.
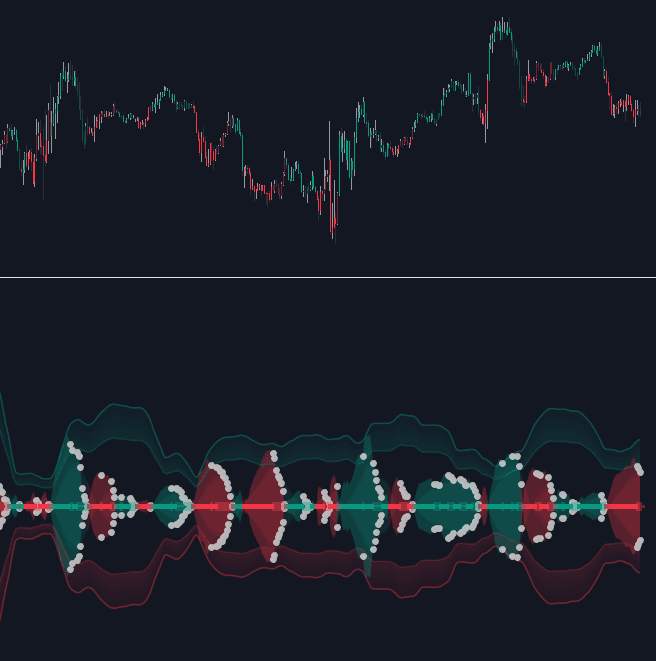
Top Dominant-cycle Detection indicator
The top custom implementation, built on the original standard Dominant-cycle Detection formula.
1 total
This Dominant-cycle Detection implementation is strategy-ready: open it in Quant, set your rules, and it backtests automatically.
What is Dominant-cycle Detection?
Dominant-cycle detection is the attempt to identify, bar by bar, the period of the strongest cyclical component currently present in price. Instead of assuming a constant rhythm the way fixed time cycles do, detection algorithms estimate the period from recent data and update it continuously. The best-known methods come from John Ehlers' signal-processing work: Hilbert-transform phase techniques, the autocorrelation periodogram, and banks of band-pass filters that score which period carries the most power. The output is a period in bars, usually smoothed, that can then tune other tools.
The method families divide by what they measure. Phase-based estimators track how fast an oscillation's phase advances and invert that into a period, fast to react and jitter-prone; spectral estimators score a whole band of candidate periods and pick the strongest, slower and steadier; filter banks sit between, running parallel band-passes and comparing their amplitudes. All three smooth their raw output, because an unsmoothed period estimate jumps enough to be unusable.
The caveat: price is not a stationary sine wave. In strong trends or pure noise the 'dominant cycle' can be too weak to mean anything, and raw estimates jump around, so serious implementations smooth the period and gate on some measure of cycle strength or signal-to-noise before anything acts on it.
On intraday charts there is a second, humbler caveat: much of what detectors find is the clock. Session structure imprints strong rhythms, the daily volume U-shape, session-boundary volatility, day-length harmonics, so a detected 32-bar cycle on a 15-minute chart may be the trading day talking rather than any market wave. Cross-checking detected periods against known time-of-day effects and session boundaries separates genuine adaptive information from expensively rediscovered schedules.
How to use dominant-cycle detection
The estimate is only as good as its gating; most failures are acting on periods that never deserved authority.
- 1Choose the estimator and know its temperament: phase-based for speed, periodogram-style for stability, filter banks in between.
- 2Confirm the preprocessing: detrending or band-limiting must precede estimation, or trend energy masquerades as a long cycle.
- 3Read the period with its strength: every serious tool exposes some amplitude or signal-to-noise measure alongside the period.
- 4Check the clock before believing an intraday period: session rhythms and day-length harmonics produce detector output that is schedule, not cycle.
- 5Use phase only under a passing strength gate: crest and trough timing means nothing when no measurable cycle exists.
- 6Watch the estimate's stability: a period that holds for dozens of bars can tune parameters; one that re-rolls every few bars should tune nothing.
How traders use it
- Driving adaptive indicators: feeding the detected period into lookback lengths (an oscillator tuned to half the dominant period, for example) so parameters track conditions instead of staying hard-coded; this is the cycle branch of adaptive parameterization.
- Timing within ranges: once the period is estimated, phase suggests where in the cycle price sits, flagging likely crest and trough windows; this is only credible when a measurable cycle actually exists.
- Regime gating: using cycle amplitude relative to noise to decide whether cycle tactics apply at all, and standing them down when trend dominates.
- Projecting turn windows: a detected period that has held converts into forward crest and trough windows, the adaptive version of the projections fixed time cycles draw from assumed constants.
- Auditing seasonal claims: a proposed rhythm from seasonality tooling should register in the detector while active; silence from the detector during the claimed cycle is evidence the pattern is averaging artifact.
Dominant-cycle detection vs other rhythm frameworks
Fixed Time Cycles: Fixed cycles assume a constant period from an anchor and project it forward; detection estimates the period from data and lets it drift. One is a hypothesis imposed on the chart, the other a measurement taken from it, with the measurement paying for its adaptivity in noise.
Intraday Time-of-day Effects: Time-of-day effects are clock-caused rhythms, measured by bucketing the session. Cycle detectors rediscover those rhythms constantly, which is why intraday detections are checked against the session statistics before being credited as market waves.
Seasonality Tooling: Seasonality averages returns by calendar slot across many periods, a slow statistical census. Detection works on the recent window only, bar by bar. The census finds persistent calendar tendencies; the detector finds whatever oscillation is live right now.
Concept family
Time, Sessions & Seasonality
32 concepts mapped · 32 in the Library
Dominant-cycle Detection FAQ
Turn Dominant-cycle Detection into a trading strategy.
Take the implementation from this page into Quant, then build on it, backtest it on real data, and keep refining it in conversation.