Price Volume Trend
 By LuxAlgoApr 13, 2020
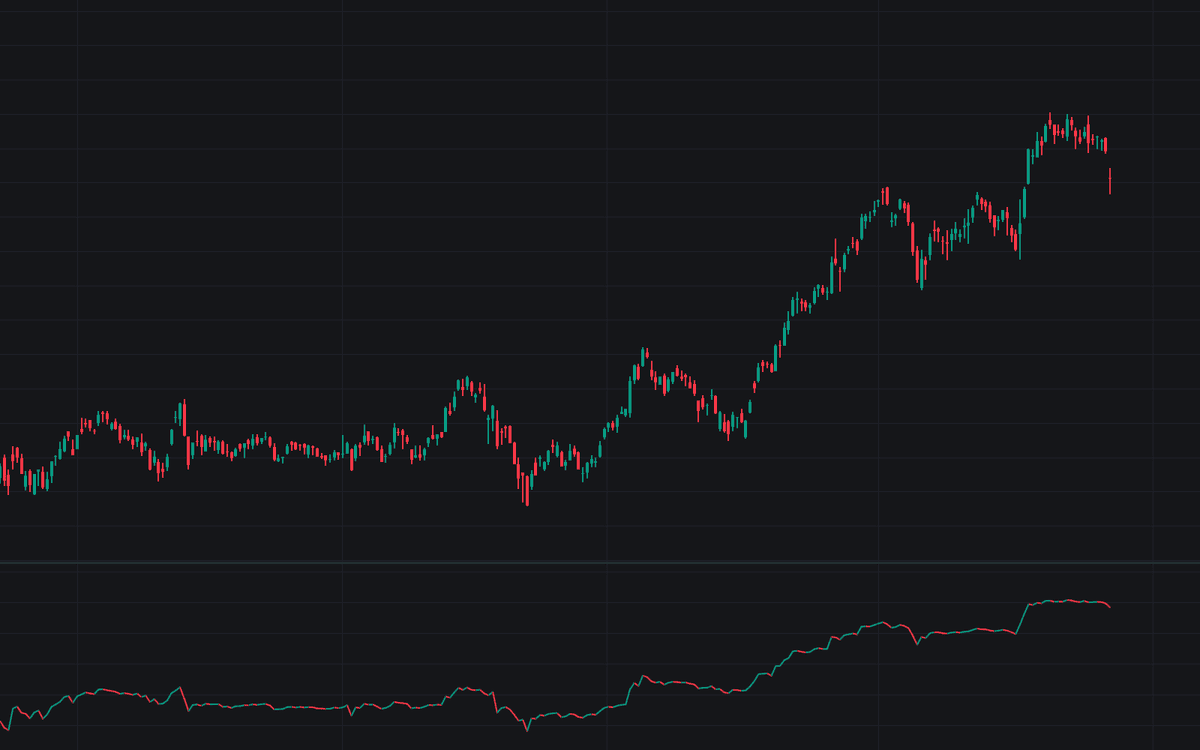

Price Volume Trend keeps a cumulative running total that adds each bar's volume multiplied by its percentage price change, so each bar's contribution reflects both how hard price moved and in which direction. Decisive sessions steer the total while near-flat closes barely register, so force and participation are read together. The line is cumulative by construction, and an optional signal moving average can be plotted alongside it. This is the classic Price Volume Trend in its standard, unmodified form.
How to Trade the Price Volume Trend?
- PVT rising with price: volume is flowing in the direction of the advance, confirming it.
- PVT falling with price: the decline is backed by proportionate volume. The pressure is genuine.
- Bearish divergence: price prints a new high while PVT stays flat or turns lower. The rally is running on thin participation.
- Bullish divergence: price makes a lower low while PVT holds a higher low. Selling force is fading.
- PVT crossing its Signal line: a cross above the average marks cumulative flow turning up, a cross below the opposite; alerts fire on both events.
Read it by swing structure as you would price: the starting level is an artifact of loaded history, so compare its highs and lows with price's rather than watching the number.
Price Volume Trend Settings
- Signal Line (default off): toggles a moving average of PVT that acts as a signal line for crossover timing.
- Signal Type (default SMA): the moving average family used for the signal line. EMA hugs the PVT more closely and crosses earlier; SMA is steadier.
- Signal Length (default 21): the number of bars in the signal average. Longer settings surface only sustained shifts in flow; shorter ones catch turns earlier at the cost of noise.
Frequently Asked Questions

The Library is free. Quant makes it yours.
Pull any concept or indicator into Quant: rebuild it, retune it, or turn it into a backtested strategy of your own.