Concept
Price Volume Trend
Price Volume Trend, also known as PVT, volume price trend, is a Volume & Order Flow concept. The Library holds 1 implementation, a working definition you can pull into Quant.
The standard Price Volume Trend indicator
Price Volume Trend exactly as classically defined: the faithful reference build of the original formula, free to run in Quant.
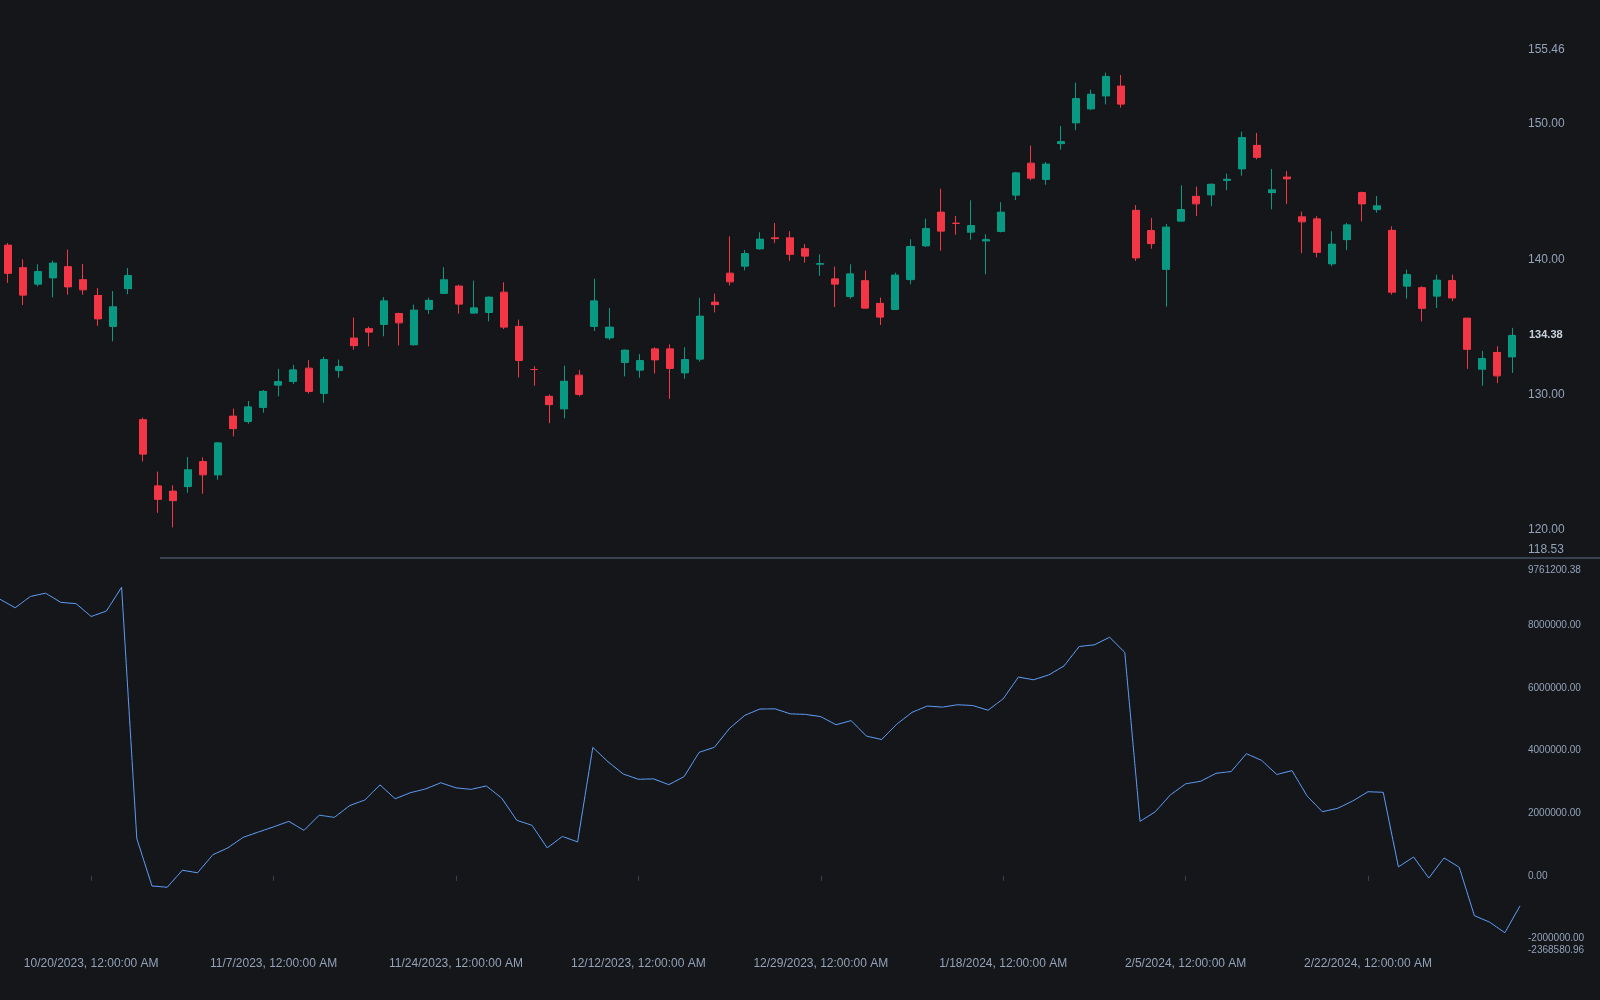
What is Price Volume Trend?
Price Volume Trend (PVT), also written as volume price trend, is a cumulative volume line that adds or subtracts a slice of each bar's volume in proportion to the bar's percentage price change. Where On-Balance Volume moves by the full bar volume whenever the close ticks up or down at all, PVT scales the contribution: a 2% up day adds twice as much of the day's volume as a 1% up day, and a flat close adds almost nothing. The result is a running total meant to track how much money is committed in the direction of the trend, weighted by how forcefully price actually moved.
The indicator exists to soften OBV's harshest simplification. Treating a one-tick up close and a limit-up close as identical events discards information; PVT keeps the sign logic but lets the magnitude of the move modulate the volume credited to it. Traders care because the line's slope and its agreement or disagreement with price form the read: a rising PVT alongside rising price suggests volume is confirming the advance, while price making new highs against a flat or falling PVT is a classic warning of thin participation.
Like all cumulative volume studies, the absolute level of PVT is meaningless; only its direction, slope, and divergences against price carry information. It is an expression of the older idea of effort versus result: volume is the effort, and PVT asks whether that effort is being spent on the side the trend claims to be moving.
How it's calculated
PVT is a running cumulative sum, seeded at zero or at an arbitrary starting value.
Some platforms plot a signal line, commonly an EMA of PVT, for crossover reads. The starting value is arbitrary, so only changes and shape are comparable, never absolute levels.
How traders use it
- Trend confirmation: a PVT making higher highs together with price is read as volume backing the move, while a lagging PVT questions it. The line is usually judged by slope and swing structure, not level.
- Divergence spotting: price at a new extreme while PVT fails to follow is treated as a regular divergence warning, the same way traders use OBV divergence. Divergences can persist for a long time before price responds, so they are context rather than triggers.
- Some traders smooth PVT with a moving average and trade crossovers of the line against its average, treating them like a slow momentum signal.
- Limitations are real: PVT still assigns all of a bar's volume to one direction based solely on the close-to-close change, so it inherits the same attribution error as OBV, just in scaled form. Gaps and low-liquidity sessions can distort the percentage term.
Price Volume Trend vs adjacent cumulative volume lines
On-Balance Volume: OBV adds or subtracts the entire bar volume on any up or down close, regardless of size. PVT scales the contribution by the percentage change, so small closes barely move it while large moves dominate.
Accumulation/Distribution Line: The A/D Line weights volume by where the close sits within the bar's high-low range, ignoring the prior close entirely. PVT weights by close-to-close change and ignores the intrabar range, so the two can disagree on gap-heavy instruments.
Chaikin Money Flow: CMF is a bounded oscillator averaged over a window rather than a cumulative line, so it mean-reverts around zero while PVT trends indefinitely.
Concept family
Volume & Order Flow
88 concepts mapped · 88 in the Library
Price Volume Trend FAQ
Turn Price Volume Trend into a trading strategy.
Take the implementation from this page into Quant, then build on it, backtest it on real data, and keep refining it in conversation.