Concept
Rectangle
Rectangle, also known as box, Darvas box, is a Chart & Candlestick Patterns concept. The Library holds 1 implementation, a working definition you can pull into Quant.
Top Rectangle indicator
The top custom implementation, built on the original standard Rectangle formula.
1 total
From studying Rectangle to trading it: take the implementation below into Quant and backtest it instantly.
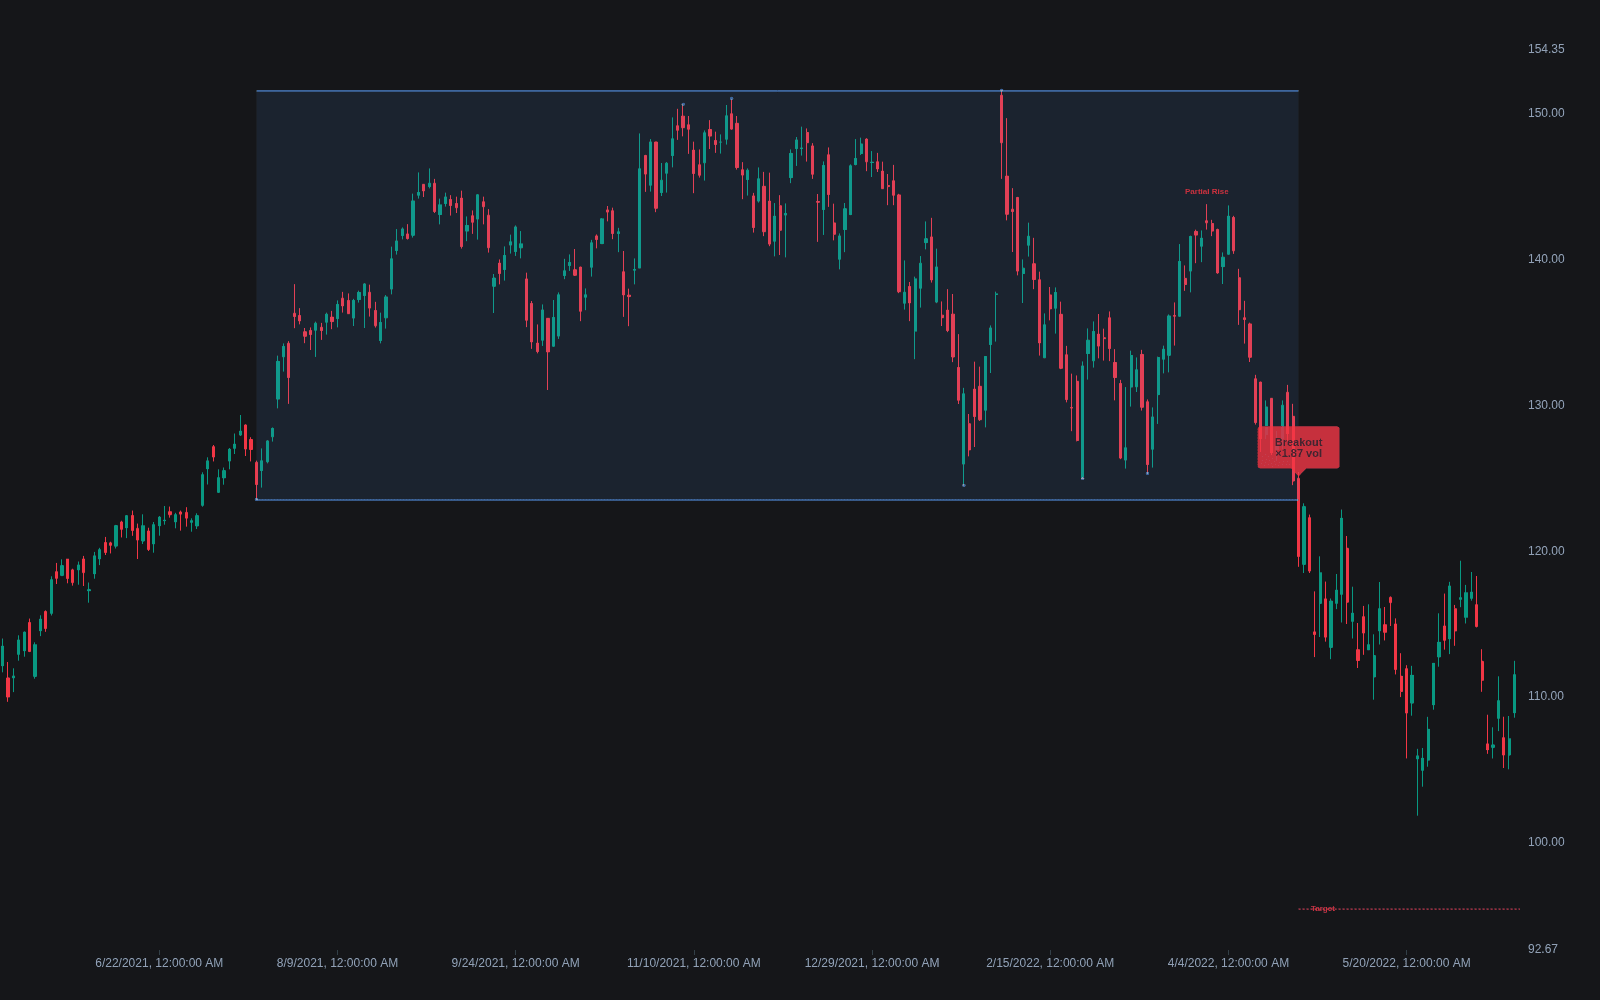
What is a Rectangle?
A rectangle is a consolidation bounded by two roughly horizontal, parallel lines: price oscillates between a flat ceiling and a flat floor, with classical convention asking for at least two touches of each boundary before the pattern earns the name. It is the chart-pattern formalization of a trading range, and the box variants popularized by Nicolas Darvas in the 1950s treat each completed rectangle as a building block in a trending stock.
The pattern has been in the canon since the earliest chart-pattern taxonomies, where it was catalogued alongside triangles as the basic sideways formation, and it acquired its most famous variant when Darvas described his box method in the 1960 bestseller about running his stock account up while touring as a dancer. The box's appeal was always its objectivity: a ceiling proven by failed pushes, a floor proven by held dips, and a rule for what to do when either gives way.
Rectangles resolve by breakout. Classical texts file them under continuation patterns because the break tends to go with the prior trend, but the boundaries carry no directional obligation and either side can give way. The standard measure rule projects the box's height from the breakout level to set a minimum objective.
What happens inside the box is the analytical question. A rectangle is two-sided by definition, sellers defending the ceiling, buyers the floor, and the volume pattern (conventionally contracting through the range, expanding on the resolution) plus the character of each boundary test hint at which side is absorbing. The pattern's known failure modes are the false breakout that traps one side before the real move goes the other way, and the slow bleed where a range simply dissolves into drift without ever resolving cleanly.
How to identify a rectangle on a chart
The boundaries must be proven by touches, not drawn by hope.
- 1Find a consolidation whose highs stall repeatedly at one level and whose lows hold repeatedly at another, with at least two genuine touches per boundary.
- 2Check the boundaries are roughly horizontal and parallel; sloping boundaries belong to channels and wedges, converging ones to triangles.
- 3Watch volume behavior: conventionally it contracts inside the box and expands on the resolution, so a quiet interior with busy boundary tests fits the pattern.
- 4Measure the box height at formation; that is the measure-rule projection base for the eventual break.
- 5Take the resolution on a decisive close beyond a boundary, not on an intrabar poke, and treat re-entry into the box as the failure signal.
- 6Grade the context: a rectangle after a strong advance resolving upward is the textbook continuation; the same box at a long-term top or bottom can be the reversal structure instead.
How traders use it
- Breakout trading: enter on a close beyond a boundary, target the box height projected from the break, and invalidate on a return inside the range; a failed break that falls back into the box is a standard cue to stand down or reverse.
- Range trading inside wide rectangles: fading the floor and ceiling while the box holds, with the known failure mode that the rotation which ends in a breakout stops out whoever faded it.
- Darvas-style trend following: in an uptrend, each new box forming above the previous one is read as continuation; entries go on the break of the box top with a stop under the box low, ratcheting upward as new boxes stack.
- Reading the interior lean: a partial rise that fails to reach the ceiling before rolling over, or a partial decline that never tests the floor, is a documented tendency toward the opposite boundary breaking, and traders use those incomplete rotations as an early bias read.
- Triggering off boundary candles: bar-level signals at the edges, a pin bar rejecting the floor or an engulfing bar at the ceiling, give range traders defined entries and stops inside the larger box logic.
Rectangle vs. neighboring patterns
Trading Range: Trading range names the market condition of two-sided rotation; rectangle is the drawn pattern, with touch conventions, boundary lines, and a measure-rule target attached.
Bull/bear Flag: Flags are brief pauses that slope against the preceding impulse; rectangles are horizontal, typically last longer, and need not sit on a flagpole.
Ascending/descending/symmetrical Triangle: Triangles have at least one converging boundary, so the range narrows toward an apex; a rectangle's boundaries stay parallel and the range width holds.
Concept family
Chart & Candlestick Patterns
84 concepts mapped · 84 in the Library
Rectangle FAQ
Turn Rectangle into a trading strategy.
Take the implementation from this page into Quant, then build on it, backtest it on real data, and keep refining it in conversation.