Support and Resistance Signals MTF
 By LuxAlgoAug 25, 2023
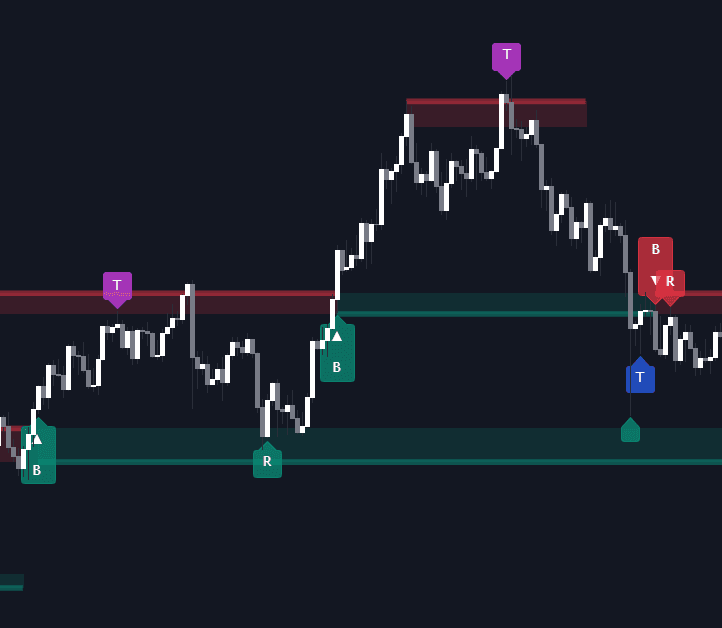

Support and Resistance Signals MTF turns support and resistance zones into a live event feed. It locates swing highs and lows, builds zones around them, then stamps the chart with the four ways price meets a level: breakouts, tests, retests, and rejections. A Detection Timeframe input brings higher-timeframe structure onto the chart you actually trade, and an optional Sentiment Profile with bullish and bearish nodes adds a read on the pressure around each zone.
How to Trade the Support and Resistance Signals MTF?
- Breakouts (non-repainting): price extends beyond a level; the signal carries the bar's volume so you can judge how much force was behind the break.
- Retests: after a breakout, price comes back to the level it broke, a classic decision point for entries and exits.
- Tests: price touches a zone and holds, evidence of the level's durability.
- Rejections: pin-bar patterns on elevated volume, often marking reversals or trend continuation at the zone.
Each event is one of the standard level interaction reads, and running detection on a higher timeframe surfaces the levels that matter beyond your chart's own resolution.
Support and Resistance Signals MTF Settings
- Detection Timeframe: the resolution used to find swings, allowing higher-timeframe levels on the current chart.
- Detection Length: sets the swing levels detection length.
- Check Previous Historical S&R Level: folds prior historical levels into the analysis.
- Per-signal options style Breakouts, Tests, Retests, and Rejections (visibility, color, size), and the Sentiment Profile has display and node color controls of its own.
Frequently Asked Questions
Free indicator
Get free access to this indicator on the platforms below.

The Library is free. Quant makes it yours.
Pull any concept or indicator into Quant: rebuild it, retune it, or turn it into a backtested strategy of your own.