Up/down Volume
 By LuxAlgoJun 22, 2026
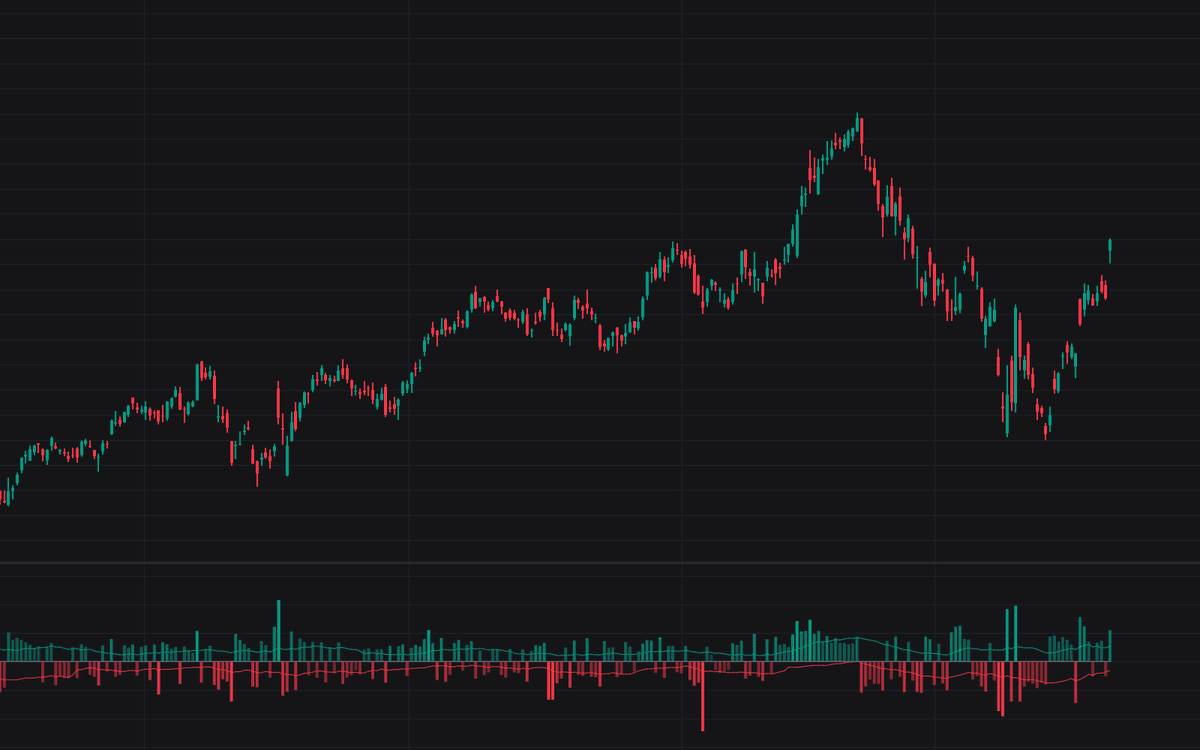

Up/down Volume sorts each bar's volume by the direction of its close (advances feed the up stream, declines the down stream) and draws the result three ways: mirrored columns, a Net Volume oscillator, or the running Cumulative Volume Index. It is a clean single-symbol rebuild of the up/down volume idea, with smoothed averages overlaying every mode and column intensity that scales with how unusual each bar's volume is.
How to Trade the Up/down Volume?
- Column dominance: one side persistently heavier shows where volume is actually flowing; gradient columns brighten on unusually heavy bars, measured against twice the recent average.
- Net Volume flips: the smoothed net difference crossing zero marks dominance changing hands. Both directions carry alerts.
- CVI against its average: in Cumulative Volume Index mode the absolute level is arbitrary; the slope, the crossings of the CVI Average, and divergences against price are what matter.
Up/down Volume Settings
- Display (default Up/down Volume): mirrored columns, the Net Volume centered oscillator, or the Cumulative Volume Index.
- Smoothed Averages (default enabled, length 20): overlays averages on the displayed series; alerts use the smoothed values whether or not the averages are shown.
- Average Type (default SMA): SMA, EMA, WMA, or RMA, applied to every smoothed average.
- Gradient Columns (default enabled): style toggle scaling column intensity with volume relative to twice its recent average.
Frequently Asked Questions

Original indicatorBuilt in-house by LuxAlgo
The Library is free. Quant makes it yours.
Pull any concept or indicator into Quant: rebuild it, retune it, or turn it into a backtested strategy of your own.