Concept
Up/down Volume
Up/down Volume, also known as Cumulative Volume Index, is a Breadth, Sentiment & External Data concept. The Library holds 1 implementation, a working definition you can pull into Quant.
VOLD
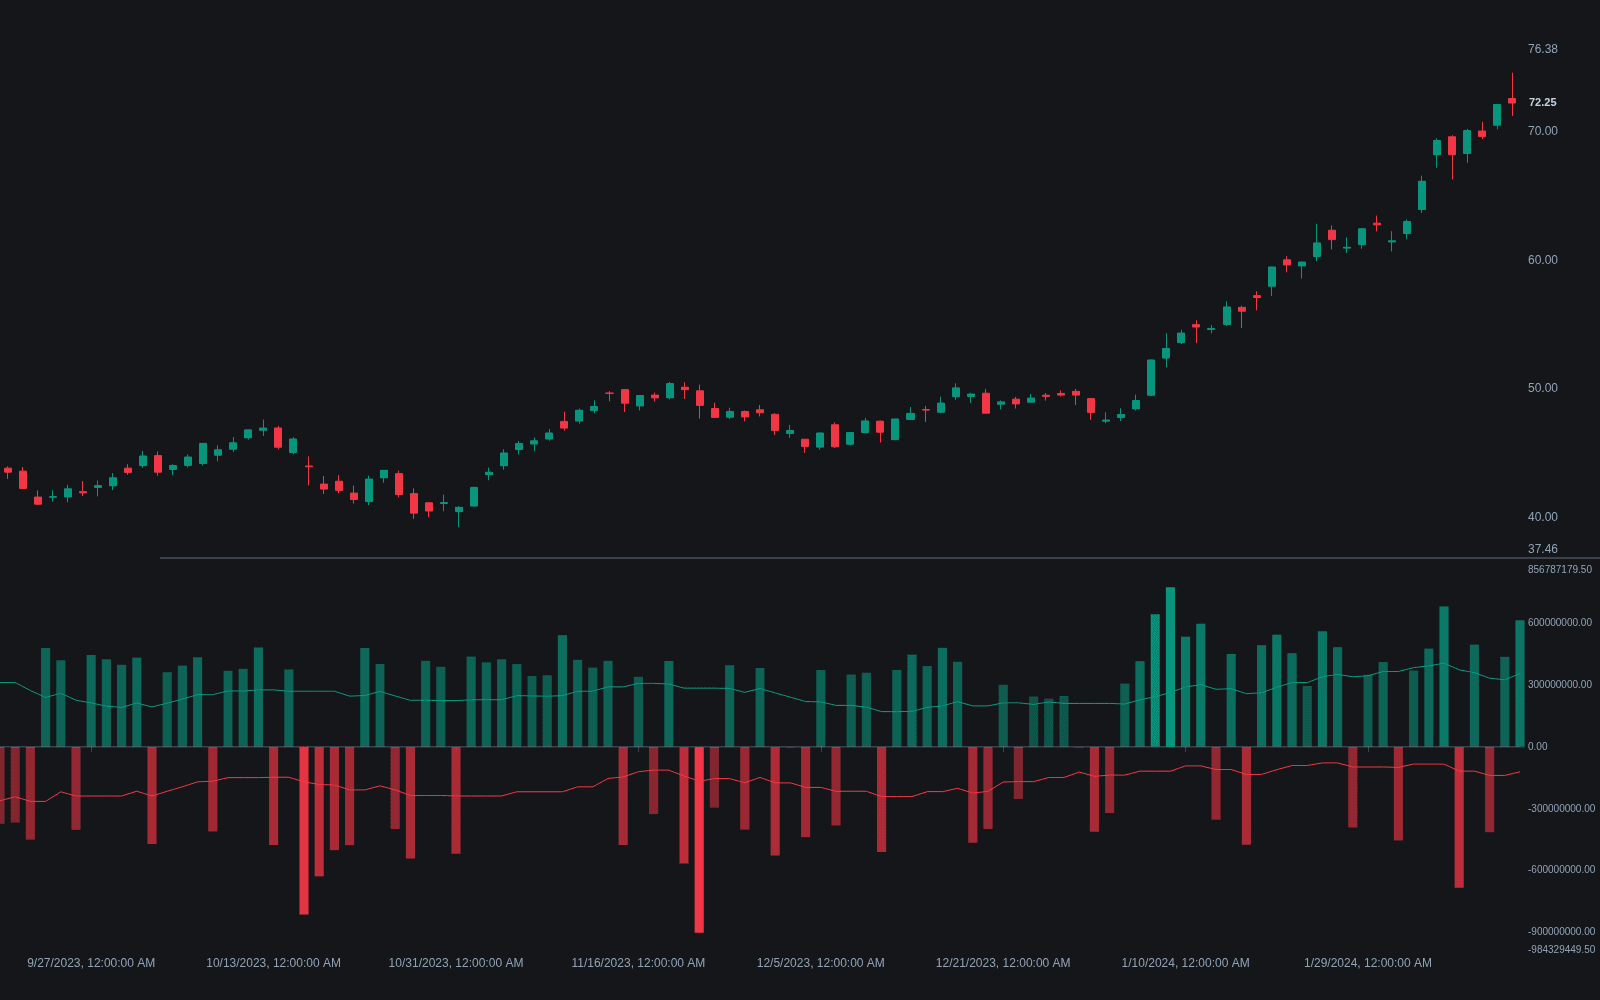
Top Up/down Volume indicator
The top custom implementation, built on the original standard Up/down Volume formula.
1 total
From studying Up/down Volume to trading it: take the implementation below into Quant and backtest it instantly.
What is Up/down Volume?
Up/down volume is a breadth measure that splits a session's total exchange volume by direction: up volume is the combined volume of advancing issues, down volume the combined volume of decliners, summed across a universe such as the NYSE or Nasdaq. The difference between the two (the VOLD spread on many platforms) shows where the volume actually went, which issue counts alone cannot: two thousand advancers on thin volume is a weaker statement than fifteen hundred advancers carrying the day's heaviest turnover. A running total of the daily net figure is the Cumulative Volume Index, the volume-weighted cousin of the advance/decline line covered under advance/decline internals.
Extreme one-sided days matter most. Sessions where up volume overwhelms down volume by roughly nine to one, a threshold Martin Zweig studied, feed several breadth-thrust rules, while equally lopsided down-volume days mark liquidation pressure.
The measure has a well-documented research trail. Zweig published his nine-to-one findings in Winning on Wall Street in 1986. Paul Desmond of Lowry Research pushed the logic further in work that won the 2002 Charles Dow Award, defining 90% downside days as panic liquidation and finding that durable bottoms were historically confirmed by a 90% upside day soon after. Richard Arms had already folded the same inputs into his 1967 Arms Index, dividing the advancer-decliner ratio by the up-down volume ratio.
Reading the series well means knowing what feeds it. Up and down volume are exchange-level aggregates, published per venue for the NYSE and Nasdaq and streamed intraday as running totals, commonly under UVOL and DVOL tickers with the net spread quoted as VOLD. Composition matters: the NYSE tape includes closed-end funds, preferreds, and other non-common issues, so some analysts track common-stock-only versions. Because every share of volume counts equally, the series measures participation rather than market capitalization, so it can disagree with a cap-weighted index.
How to Read Up/down Volume on a Chart
There is no pattern on the price chart; identification means loading the right series and classifying the session.
- 1Chart the exchange's up-volume and down-volume series or their difference, typically via UVOL, DVOL, and VOLD symbols; lacking a spread symbol, a ratio chart of the two works.
- 2Classify trend days early: a spread that opens skewed and widens all session, one side running several times the other, supports trend-day tactics, especially when the TICK Index agrees.
- 3Classify balance: a spread oscillating around zero or flipping sign repeatedly marks two-way rotation, with little directional edge from breadth.
- 4For thrust or washout study, compute the closing up share, up volume divided by up plus down volume; 90% or more marks a genuinely one-sided session.
How it's calculated
Exchange-level breadth that splits a session's total volume into the part traded in advancing issues versus the part traded in declining issues.
Volume in unchanged issues is excluded, and universe composition matters: the NYSE tape includes funds and preferreds, so some analysts track common-stock-only versions.
Because the CVI's base is arbitrary, read its slope and divergences against the index rather than its absolute level.
The 90 percent thresholds follow Martin Zweig's 9-to-1 up-volume day studies and Lowry Research's 90 percent downside-day work.
How traders use it
- As an intraday conviction gauge: day traders watch the running up/down volume spread alongside the TICK; a spread that grinds steadily in one direction supports trend-day tactics, while a spread oscillating around zero argues for range tactics.
- As confirmation for index moves: a new high backed by strong net up volume is better supported than one where up volume barely exceeds down volume, and a persistent divergence between price and cumulative volume breadth is a classic warning, though it can run for a long time before it matters.
- As a thrust and washout detector: runs of nine-to-one up-volume days after a decline are read as initiation evidence, and nine-to-one down days as capitulation candidates, with the caveat that a single extreme day reverses nothing by itself.
- As an input to composite gauges: the Arms Index pairs it with issue counts for a short-horizon extremes read, and smoothed net-volume tools such as the library's Swenlin Trading Oscillator turn the daily spread into a swing-timing series.
- As a participation check: comparing volume breadth with the % of stocks above key moving averages separates broad advances from narrow megacap-driven ones, while a VIX backdrop helps grade lopsided down days as panic or drift.
Up/down Volume vs Other Breadth Gauges
Advance/decline Internals: Advance-decline counts give every stock one vote regardless of size or turnover. Up/down volume weights the same vote by trading activity, so comparing the two shows whether the money agrees with the issue counts; divergences between them are a classic study.
TICK Index: The TICK is an instantaneous snapshot, the number of NYSE stocks last trading on an uptick minus a downtick, resetting moment to moment. Up/down volume accumulates across the session, so day traders use TICK for timing and the volume spread for the day's character.
% Stocks Above 20/50/200-day MA: Percent-above-MA gauges measure where stocks sit relative to their trends, a positioning reading that evolves over weeks. Up/down volume measures a single session's directional flow. One describes the regime, the other the day's conviction; they complement rather than substitute.
Concept family
Breadth, Sentiment & External Data
63 concepts mapped · 63 in the Library
Up/down Volume FAQ
Turn Up/down Volume into a trading strategy.
Take the implementation from this page into Quant, then build on it, backtest it on real data, and keep refining it in conversation.