5 Long-Legged Doji Entry Strategies
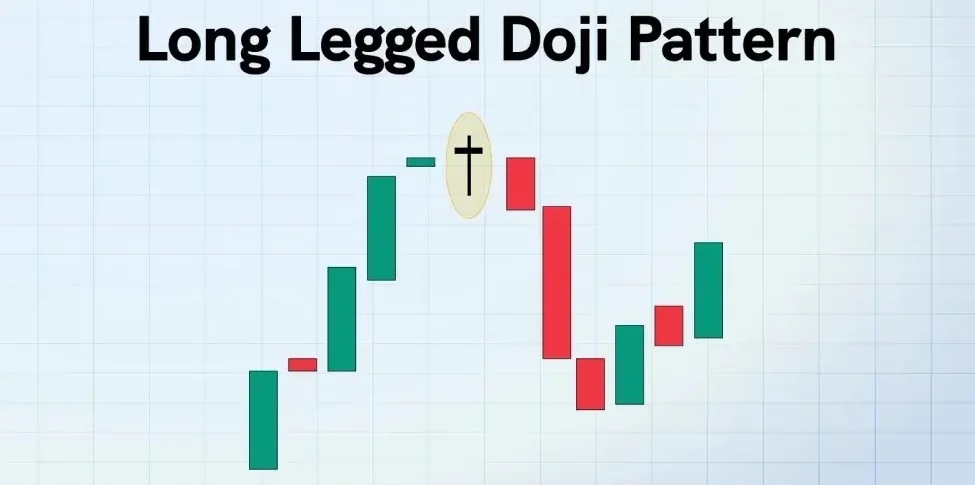
The long-legged doji is the candlestick market's clearest picture of a stalemate. Price travelled a long way above and below the open during the session and then closed back where it started, so the candle has almost no real body and long shadows on both sides. Because it records indecision rather than direction, it is one of the most misused patterns in trading education: the doji is frequently described as a reversal signal, when the published evidence says its breakout direction is close to random. This guide explains what the candle is, what the LuxAlgo Library and Thomas Bulkowski's candlestick testing say about it, and five entry strategies that use the doji as a location and trigger rather than as a forecast, with notes on how to test each one with Quant in Quant Charts.
What a Long-Legged Doji Is and Is Not
The LuxAlgo Library's Doji entry defines the family: a candlestick whose open and close land at, or almost at, the same price, so the real body collapses while the shadows record the session's full travel. Wick structure defines the variants. The long-legged doji has long shadows on both sides; the dragonfly doji closes near its high above a long lower shadow; the gravestone doji closes near its low beneath a long upper shadow; and the rare four-price doji prints when all four prices are equal, usually on very thin trading. One step short of a doji is the spinning top, which keeps a small but visible body between two shadows.
Two points from the Library entry shape everything that follows. First, "nearly equal" is a judgment call: coded detectors typically require the body to be a small fraction of the high-low range, and the exact threshold is a convention that varies by source, so two scanners can disagree about the same candle. Whatever cutoff you choose, make it explicit and apply it consistently. Second, a doji carries little information on its own; its weight comes from location. After a sustained advance or decline it shows the trend failed to extend into the close, which candlestick tradition reads as an early trend exhaustion warning rather than a reversal in itself. Inside a quiet range, near-zero bodies are routine and mean little.
Thomas Bulkowski's tests, published on ThePatternSite from his Encyclopedia of Candlestick Charts, put a number on the indecision. Across his sample the long-legged doji acted as a bullish continuation 51 percent of the time, which he treats as random, and he concludes that depending on the candle to hint at a direction is a mistake. His identification guidelines are simple: one candle, no required prior trend, opening and closing prices within a few pennies of each other, and shadows longer than those on recent candles, with no requirement that the two shadows match. He does record two useful conditional findings: doji candles with shadows taller than the median moved about 50 percent farther than those with shorter shadows, and doji candles forming within a third of the yearly low performed best. Those are the observations the strategies below are built to exploit.
The Five Entry Strategies
Each strategy below uses the doji for what the evidence supports: as a marker that the market is contested at a particular place, with the direction decided by what happens next. The Library's own rule for the doji is the common thread: wait for the next candle, because direction comes from the confirmation bar, not the doji itself, and a decisive close away from the doji's range is the usual trigger.
1. Doji range break with a confirmation close
The baseline method sets a bracket around the candle. Place a buy trigger above the doji's high and a sell trigger below its low, and let the market pick the direction. The Library's Breakout Confirmation entry lists the filters that separate a real break from a head-fake: require a close beyond the level rather than an intrabar tick, require penetration by a minimum buffer such as a fraction of average true range, or wait for the retest that holds. Every filter buys information with price, so waiting for a close means a worse entry on the breaks that run and fewer losses on the ones that fail. The stop belongs beyond the opposite shadow, and because a long-legged doji has a wide range by definition, the stop distance is wide too. That is the main cost of the pattern and the reason position size has to be solved from the stop rather than chosen first.
2. Doji inside a support or resistance zone
Location is where the doji earns its keep. The Library's S/R Zone entry describes support and resistance as a band rather than a single price, with edges commonly set from the extreme wick of the defining touches to the nearest cluster of candle bodies, and it sets the geography of a trade: entries staged inside the band, stops placed beyond its far edge, targets trimmed ahead of the next zone. A long-legged doji printing inside a zone that has been tested from separate visits frames a contested auction at exactly the place where resting interest is expected. The entry is the same range break as strategy one, but only taken in the direction that leaves the zone, and the stop moves from the doji's shadow to the far edge of the zone. The entry also warns that zones are perishable: each test consumes some of the interest that made the area react, so heavily revisited zones deserve a discount.
3. Doji at a Bollinger Band extreme
Bollinger Bands place a 20-period simple moving average between bands two standard deviations above and below it, so the bands widen in volatile markets and tighten in quiet ones. A doji whose shadows reach beyond the upper or lower band shows price stretched against its recent average and then rejected back inside. The Library's caution applies directly: a band tag is information, not a signal, and in strong trends price can close along a band for many bars. Bollinger's own account is that default settings contain roughly 88 to 89 percent of price action rather than the textbook 95, so closes beyond the bands are expected events. The strategy therefore requires two things after the doji: a confirmation close back toward the middle band, and no fresh band expansion in the direction of the prior move. The middle band is the natural first target, since it doubles as a drifting mean for reversion trades.
4. Volatility-qualified doji with ATR
Bulkowski's finding that taller shadows led to larger moves suggests filtering for candle height, and ATR is the standard yardstick. Average True Range, from J. Welles Wilder's 1978 work, averages each bar's true range over a lookback of 14 periods by default, and it is direction-blind and denominated in price units. A practical filter takes only doji candles whose high-to-low range exceeds a multiple of the current ATR, such as 1.5 times, so the candle is unusually large for the instrument's own recent conditions rather than large in absolute terms. ATR then does double duty on the exit: stops set in ATR multiples breathe with conditions instead of using fixed ticks, and position sizes scaled to ATR keep risk broadly comparable across instruments. The entry stays a confirmation close beyond the doji's range.
5. Momentum confluence with RSI and MACD
The fifth approach asks a momentum oscillator whether the stall the doji shows is also visible in the rate of change of price. The RSI entry gives the grammar: readings above 70 are conventionally overbought, below 30 oversold, and Wilder's own signals were the RSI failure swing, where RSI reverses from an extreme and breaks its own pivot, and divergence between price extremes and RSI extremes. MACD supplies a second, slower read: the histogram inflection is the earliest of its three signals, with shrinking bars showing the spread between the 12 and 26 period averages narrowing before any cross prints. A long-legged doji at a new price high while RSI prints a lower high, or while the MACD histogram has been shrinking for several bars, is a doji with corroboration. The trade is still triggered by the confirmation close, and the oscillators are used as a filter on which range breaks to take, never as the entry themselves.
The Five Strategies Compared
| Strategy | What qualifies the doji | Trigger and stop |
|---|---|---|
| Range break | Any long-legged doji | Close beyond the doji's high or low; stop beyond the opposite shadow |
| S/R zone | Doji inside a tested support or resistance band | Close leaving the zone; stop beyond the far edge of the zone |
| Bollinger extreme | Shadows beyond a band, no fresh expansion | Close back toward the middle band; stop beyond the extreme shadow |
| ATR filter | Doji range above a multiple of current ATR | Close beyond the doji's range; stop at an ATR multiple from entry |
| Momentum confluence | RSI divergence or an RSI failure swing, MACD histogram shrinking | Close beyond the doji's range in the oscillator's direction; stop beyond the opposite shadow |
Risk Management for Wide-Range Candles
A long-legged doji is wide by definition, so a stop beyond its shadow is far from the entry. The Library's Fixed Fractional entry gives the arithmetic: size is back-solved from the stop, with equity times the risk fraction divided by the per-unit distance from entry to stop. A wider doji simply means fewer shares or contracts for the same dollar risk; it never means moving the stop closer to make a preferred size fit. Two further points follow from the Library's guidance. Confirmation entries taken a full candle after the doji forms are already some distance from the shadow, which widens the stop further and lowers the reward available before the next level, so targets should be set from the chart, at the next zone or the Bollinger middle band, rather than from a fixed multiple. And because the doji's breakout direction is close to random on the evidence, the strategies above will produce a meaningful share of losers; a daily loss limit and a consecutive-loss breaker, as described in the Library's Loss-control Rules, keep a run of failed breaks from compounding.
Limitations
- No directional edge on its own. The 51 percent continuation rate in Bulkowski's testing means the candle by itself should not be traded against the trend or in its favour. Direction has to come from the confirmation close and the context.
- Definition drift. Body-to-range thresholds vary across scanners, so a doji on one platform can be a spinning top on another. Any backtest is only valid for the exact threshold coded into it.
- Timeframe and liquidity. Four-price and near-four-price doji candles on illiquid symbols reflect a lack of trading rather than a contested auction. The pattern is more informative where volume is meaningful.
- Wide stops. The pattern's defining feature is also its cost. Strategies that cannot tolerate wide stops should skip the doji or use the S/R zone version, where the stop is set by the level rather than the candle.
Where Quant Charts Fits
Quant Charts, the LuxAlgo charting and AI platform, provides the detection, testing and record-keeping for these strategies. It does not place orders.
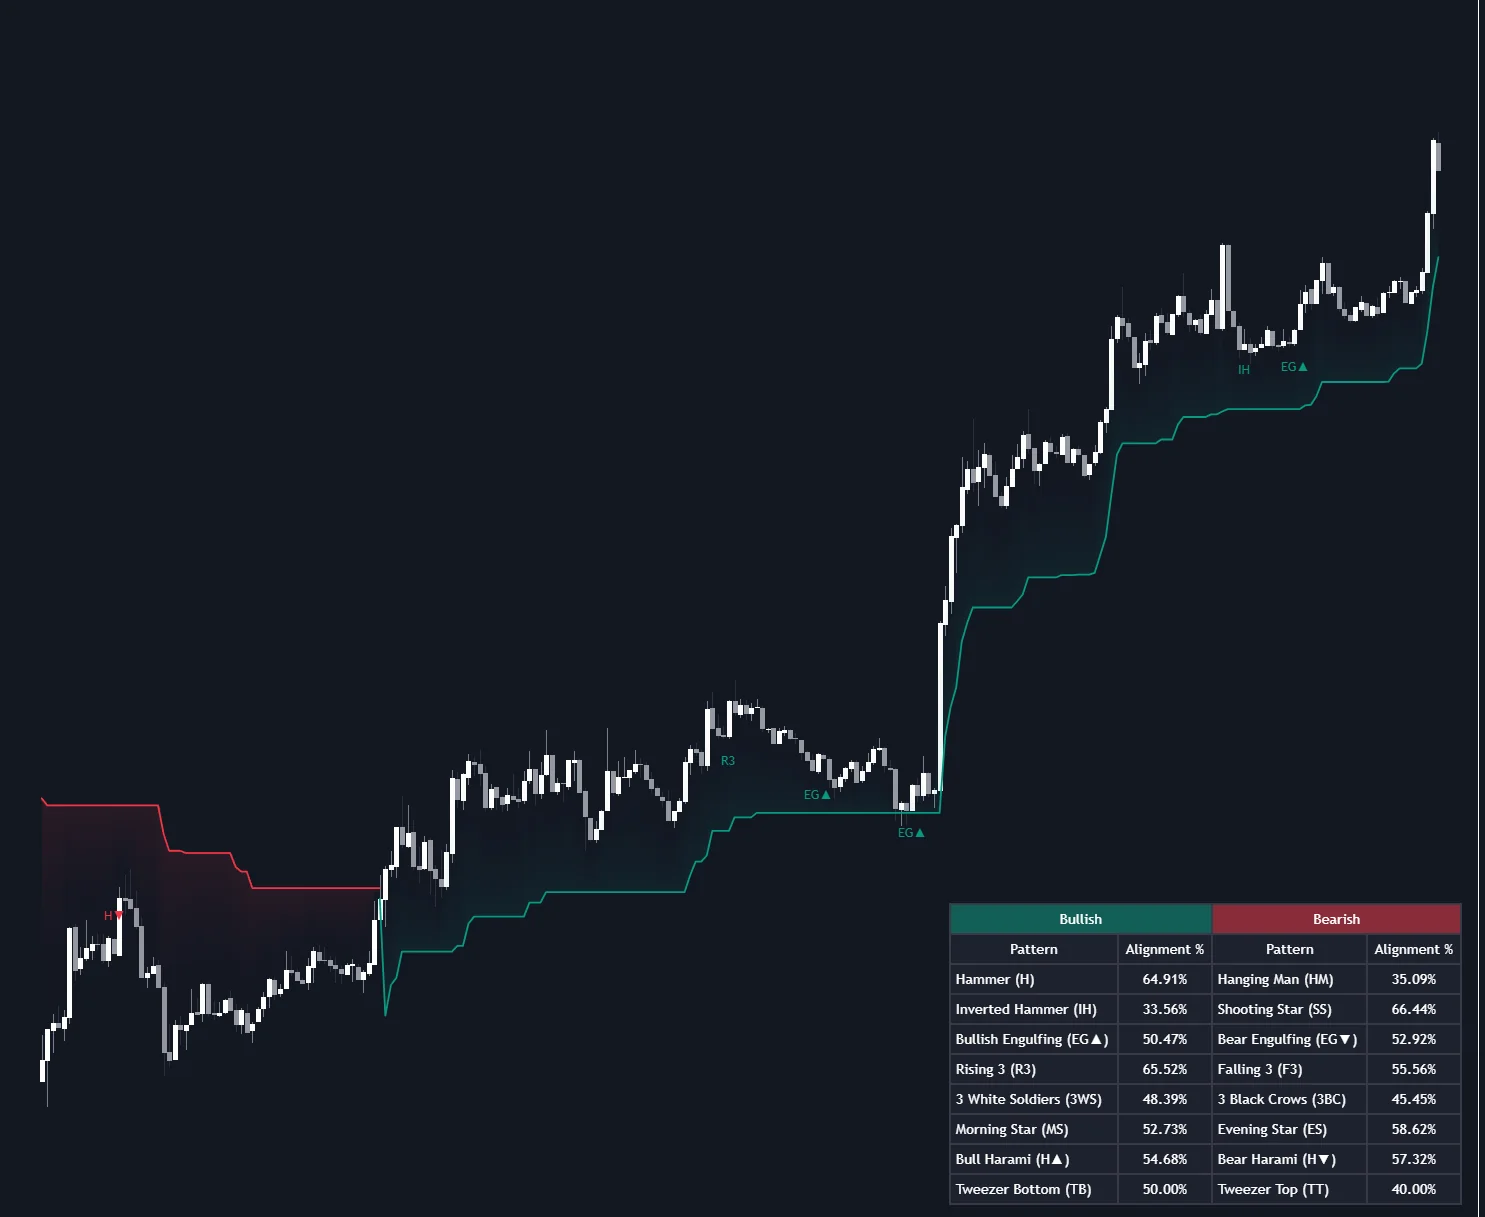
- Detection. The Library's Candlestick Structure indicator, the implementation listed on the Doji entry, labels doji and related single-candle patterns on the chart. Add it from the indicators menu alongside Bollinger Bands, ATR, RSI or MACD from the Library to see the confluence conditions on one chart.
- Testing. Quant, our coding agent, writes Pine Script from a plain-language description. Describe a rule such as entering on a close above the high of a doji whose body is under 10 percent of its range and whose range exceeds 1.5 times the 14-period ATR, with a stop below the doji's low, inspect the Code tab, and click Run. The Backtest Summary reports net profit, trade count, win rate, max drawdown and profit factor; commission and slippage are set in the strategy Properties so the wide stops and frequent losers are costed honestly. Change the body threshold or the ATR multiple and rerun to see how sensitive the result is to the definition.
- Data. Quant Charts data covers Cboe EDGX US equities, including ETFs, and crypto on every plan; paid plans add forex, commodities and CME futures.
- Review. The Journal, on every plan, groups fills into round trips and breaks results down by symbol, side, day and hold time, which is how to check whether the S/R zone version or the Bollinger version is the one actually paying in your own trading.
Conclusion
The long-legged doji tells you where the market argued and failed to decide, not which way it will go. Treated that way, it is a useful candle: it marks a contested price, its range gives natural trigger and stop levels, and its height, per Bulkowski's testing, says something about how far the eventual move may travel. Each of the five strategies adds a reason to prefer one direction, from a tested zone, a stretched Bollinger Band, an unusual range against ATR, or a momentum divergence, and all five wait for the confirmation close the Library recommends. Test the exact definition you intend to trade before trading it, and size from the stop the candle gives you.
FAQs
What is a long-legged doji?
A single candlestick whose open and close are almost equal, leaving a near-zero real body, with long upper and lower shadows. It records a session in which both buyers and sellers moved price substantially but neither held the gain into the close.
Is a long-legged doji bullish or bearish?
Neither on its own. Bulkowski's testing found the candle acted as a bullish continuation about 51 percent of the time, which is effectively random. Direction comes from the confirmation candle and the context, such as a support or resistance zone.
How small must the body be to count as a doji?
There is no universal figure. Candlestick literature says open and close should be virtually equal, and coded detectors translate that into a maximum body-to-range fraction. The threshold is a convention that differs across platforms, so state yours explicitly when you backtest.
Where should the stop go on a doji trade?
Beyond the shadow opposite the entry for a plain range break, beyond the far edge of the zone for a support or resistance trade, or at an ATR multiple from entry for the volatility-filtered version. Size the position from that stop distance rather than moving the stop to fit a size.
How is a long-legged doji different from a spinning top?
A spinning top has a small but clearly visible real body between two shadows; a doji's body is essentially zero. Both read as indecision, with the doji the more extreme statement of it, and the boundary between them depends on the body threshold used.
Can Quant Charts detect long-legged doji candles and backtest these strategies?
Yes. The Library's Candlestick Structure indicator labels doji candles on the chart, and Quant can write a Pine Script strategy from a plain-language description of the entry, filter and stop, then report net profit, trade count, win rate, max drawdown and profit factor in the Backtest Summary. Quant Charts does not place orders.
References
LuxAlgo Resources
- Doji
- Spinning Top
- Trend Exhaustion
- S/R Zone
- Breakout Confirmation
- Bollinger Bands
- ATR
- RSI
- MACD
- Fixed Fractional
- Loss-control Rules
- Candlestick Structure indicator
- Quant Charts docs: Quant strategies
External Resources
This article is for educational purposes only and is not financial advice. Candlestick patterns describe past price behaviour and do not guarantee future results.
Read next