Concept
Sigmoid/softmax Transforms
Sigmoid/softmax Transforms are Statistics concepts. The Library holds 2 implementations, each one a working definition you can pull into Quant.
Top Sigmoid/softmax Transforms indicators
The top custom implementations, built on the original standard Sigmoid/softmax Transforms formula.
2 total
Every Sigmoid/softmax Transforms implementation here is strategy-ready: open one in Quant, set your rules, and it backtests automatically.
.png&w=3840&q=75)
What are Sigmoid/softmax Transforms?
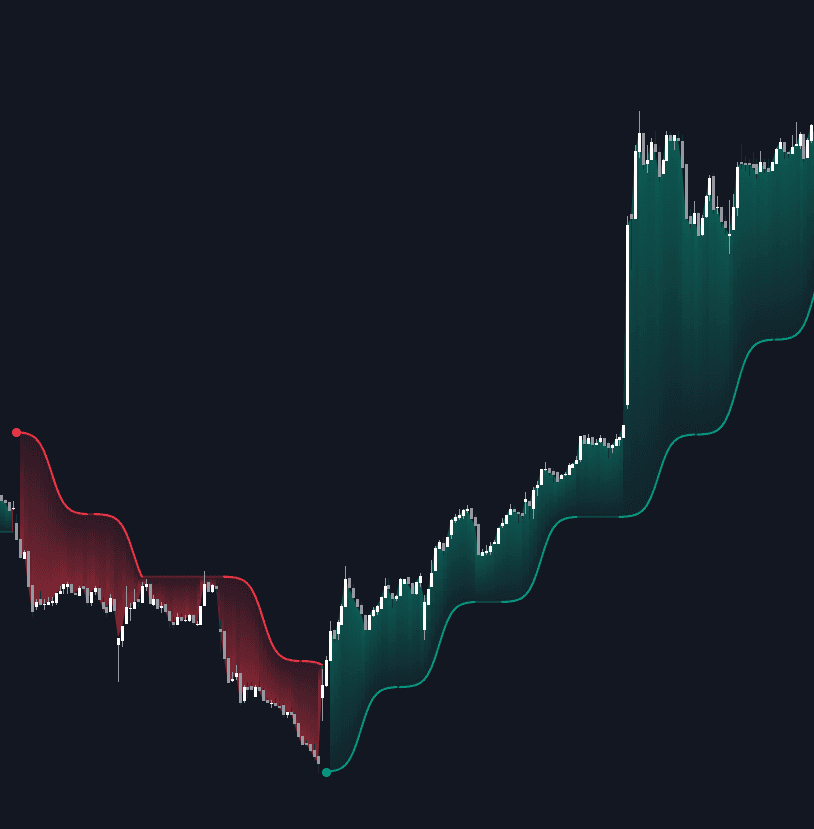
Sigmoid transforms are S-shaped functions that squash an unbounded input into a fixed interval. The logistic function maps any real number into the open interval from 0 to 1; the hyperbolic tangent maps into minus 1 to plus 1; arctangent variants behave similarly. Near zero the mapping is close to linear, and it saturates toward the bounds as inputs grow, so ordinary readings keep their differences while outliers are compressed against the rails.
The functions are old mathematics wearing new jobs: the logistic curve dates to nineteenth-century growth modeling, tanh and arctangent are standard analysis, and softmax's name spread through the machine-learning literature, where it serves as the output layer that turns scores into class probabilities. Indicator work borrowed all of them for the same reason ML did, differentiable, monotonic squashing with tunable steepness.
Softmax is the vector version: it exponentiates a list of scores and divides each result by the sum of the results, producing positive weights that add up to one, which reads like a probability across competing alternatives. In indicator work, sigmoids appear wherever an unbounded series needs a bounded display, most famously the inverse Fisher transform, which pushes a scaled oscillator through the hyperbolic tangent so readings crowd near the extremes. The transform reshapes a series; it adds no new information.
The working parameter is the gain (in softmax, the temperature): a multiplier applied before the squash that sets how quickly the function saturates. High gain turns the sigmoid toward a step function, pinning readings at the rails and making the display nearly binary; low gain keeps it near-linear and gentle. The same dial governs softmax's decisiveness, concentrating weight on the top score or spreading it evenly, which is why the pre-scaling, commonly a Z-score standardization, is as much a design choice as the function itself.
How to read a sigmoid-transformed indicator
The squash changes the geometry, not the content; reading one means knowing what was fed in and how hard it was squeezed.
- 1Identify the input series and its pre-scaling: a tanh of a z-scored momentum and a tanh of raw momentum are different animals with the same shape.
- 2Note the bounds and midline: 0-to-1 transforms center on 0.5, tanh-style transforms on zero, and the midline crossing is the input's own zero cross.
- 3Read saturation as regime: readings pinned against a rail mean the input is large by its own recent standards, and time spent at the rail is the persistence read.
- 4Watch departures from the rails: with extreme-hugging shapes, the informative event is usually the reading leaving the extreme, not sitting at it.
- 5Treat thresholds as portable: the whole point of bounding is that a 0.9 means the same thing across instruments, provided the pre-scaling was standardized.
How traders use it
- To bound unbounded oscillators (momentum differences, volume deltas, regression slopes), usually standardized first as a Z-score, so fixed thresholds and cross-instrument comparisons make sense.
- To reshape an oscillator's behavior: tanh-style shaping makes readings spend more time pinned near the extremes, so departures from an extreme zone stand out more clearly.
- To turn raw scores into weights: softmax over several signal or regime scores yields a normalized weighting for ensemble voting, and a logistic squash maps a single score onto a 0-to-1 confidence-style scale.
- To soften switches: passing a regime score through a gentle sigmoid converts a hard on/off gate into a graded blend, so strategies scale in and out of conditions instead of toggling at a threshold.
- To build bounded displays: standardized deviations squashed into a fixed interval drive heat-style backgrounds and meters that stay legible across symbols, the display-layer cousin of a percentile rank.
Sigmoid squashing vs other normalizations
Z-score: The z-score standardizes location and scale but stays unbounded, so outliers still stretch the axis. The sigmoid is the complementary step: applied after standardization, it fixes the display range while preserving ordinary readings' differences.
Percentile Rank: Rank bounds a series empirically, by counting where the value sits in its own history, with no functional form at all. The sigmoid bounds analytically, by formula, keeping magnitude information near the center that rank deliberately discards.
Concept family
Statistics
46 concepts mapped · 46 in the Library
Sigmoid/softmax Transforms FAQ
Turn Sigmoid/softmax Transforms into a trading strategy.
Take any implementation from this page into Quant, then build on it, backtest it on real data, and keep refining it in conversation.