Concept
5/35 Oscillator
5/35 Oscillator, also known as Elliott oscillator, is a Momentum & Oscillators concept. The Library holds 1 implementation, a working definition you can pull into Quant.
Top 5/35 Oscillator indicator
The top custom implementation, built on the original standard 5/35 Oscillator formula.
1 total
From studying 5/35 Oscillator to trading it: take the implementation below into Quant and backtest it instantly.
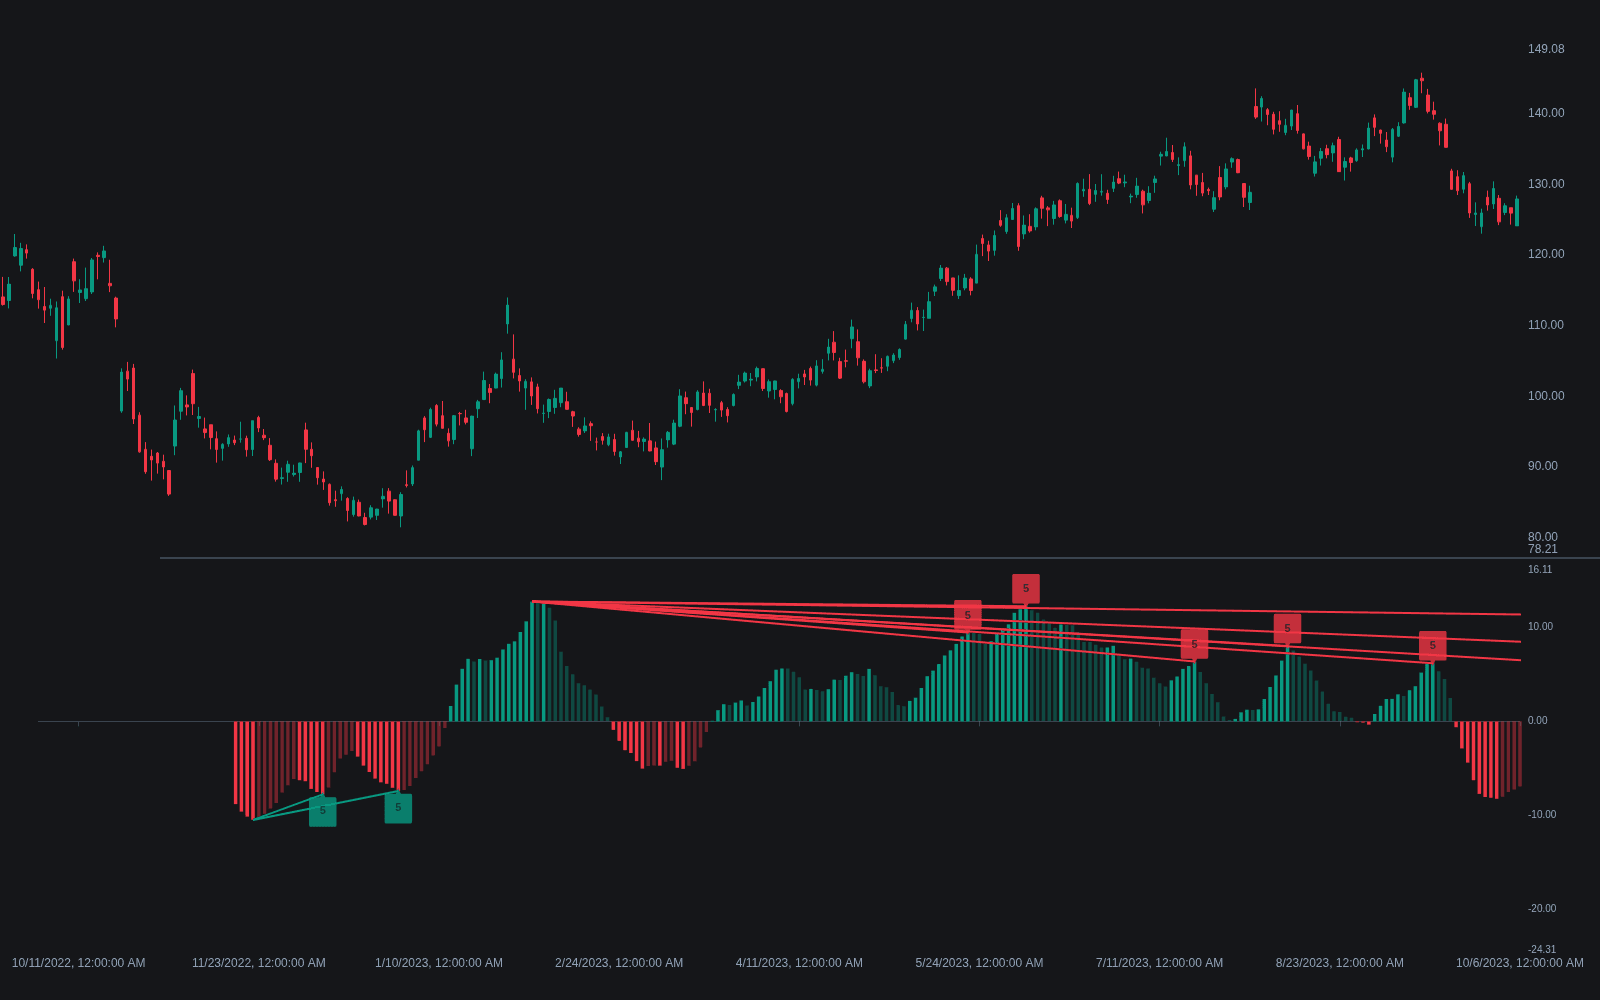
What is the 5/35 Oscillator?
The 5/35 Oscillator, widely known as the Elliott Wave Oscillator (EWO), is the difference between a 5-period and a 35-period simple moving average, plotted as a histogram around zero. Implementations differ on the input (some average the close, others the bar midpoint), but the intent is constant: the short average captures the swing underway, the long average approximates the trend one degree higher, and their spread turns wave strength into a comparable number. Its popularity comes from computerized Elliott analysis, where Tom Joseph's wave-counting method made the 5/35 pairing standard.
It matters because Elliott counts need an independent strength gauge. In that tradition, the histogram's largest extreme tends to print during wave 3, typically the strongest leg of a five-wave impulse; the fourth-wave correction commonly pulls the reading back to or through zero; and a fifth-wave price extreme against a smaller oscillator peak creates the divergence that flags completion. These are guidelines with exceptions, not rules: the oscillator cannot label waves by itself, and readings only make sense on a timeframe sized to the wave degree being counted.
The tradition traces to Tom Joseph, founder of Trading Techniques and developer of the Advanced GET software that brought mechanical Elliott analysis to retail desks from the late 1980s onward. Joseph needed a strength gauge his counting algorithms could lean on, and the 5/35 spread became his standard. Bill Williams' Awesome Oscillator, a 5/34 spread of the bar midpoint, is the same idea to within one period, and on most charts the two plots are near-identical.
The histogram is positive whenever the 5-period average sits above the 35-period one, so a zero cross is simply the short average crossing the long. The limits follow from the construction: the spread is denominated in price, so absolute readings are not comparable across instruments or eras, only the shape of the current sequence matters; and because both inputs are simple moving averages, it is a smoothed, lagging momentum statistic, unbounded and without fixed overbought or oversold levels.
How to read the 5/35 Oscillator in a wave count
Used the traditional way, the oscillator maps onto a five-wave impulse in a fixed sequence.
- 1Size the chart first: a common guideline has the suspected impulse spanning roughly 100 to 150 bars, the scale the 5/35 lengths were tuned for; the mapping degrades far outside it.
- 2Expect the histogram's most extreme reading of the sequence during wave 3; if a later push prints a stronger reading, the tradition relabels that push as still part of wave 3.
- 3Watch wave 4 pull the oscillator back toward zero, commonly crossing it; a pullback that barely dents the reading argues the third wave is still extending.
- 4Look for wave 5 to reach a new price extreme while the oscillator posts a clearly smaller peak: that divergence is the traditional completion signal, and its absence warns the count may be early.
How it's calculated
Momentum measured as the spread between a fast 5-bar and a slow 35-bar simple moving average of price.
The original Advanced GET Elliott oscillator uses median price; many platforms compute it on the close instead.
Usually plotted as a histogram around zero, where zero marks the crossing of the two averages.
The 5/34 Awesome Oscillator is the same construction with a slow length of 34.
How traders use it
- To separate third waves from fifth waves in real time, since the two can look similar on price but usually differ in oscillator magnitude.
- As a wave-4 timing aid: trend-direction entries are staged as the oscillator returns toward zero, targeting the fifth wave, ideally with the pullback showing a clearly corrective, overlapping structure.
- As a generic momentum histogram outside Elliott work, read like any MA-spread oscillator such as MACD: zero crosses for bias, histogram slope for acceleration.
- For divergence work beyond wave counting: regular divergences at price extremes warn of fatigue, while hidden divergence during pullbacks argues the trend has another leg in it.
- As a cross-check against bounded oscillators: because the 5/35 has no fixed scale, traders pair it with RSI or the Stochastic Oscillator for overbought and oversold context.
5/35 Oscillator vs. similar oscillators
MACD: MACD spreads two EMAs of the close and layers a signal line and histogram on top. The 5/35 is a single bare SMA spread with no signal line, conventionally interpreted through wave position rather than crossovers.
ROC: ROC measures the percent change of price over one lookback, a raw reading that jumps with every bar. The 5/35 compares two smoothed baselines, so it reacts more slowly but filters single-bar noise; its histogram shape, not its absolute value, carries the meaning.
RSI: RSI compresses momentum into a bounded 0-100 scale read against fixed thresholds. The 5/35 is unbounded and price-scaled, with no standing thresholds; it is read through the relative height of successive peaks within one sequence.
Concept family
Momentum & Oscillators
91 concepts mapped · 91 in the Library
5/35 Oscillator FAQ
Turn 5/35 Oscillator into a trading strategy.
Take the implementation from this page into Quant, then build on it, backtest it on real data, and keep refining it in conversation.