Liquidation Levels
 By LuxAlgoOct 19, 2023
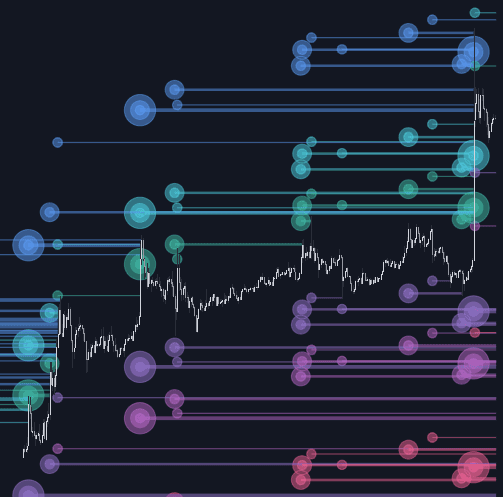
Liquidation Levels projects where the market's forced exits are likely parked, so you see the magnets before price does. It watches for bars carrying significant trading activity, then anchors clusters of leveraged positions to them: a bubble marks the event, sized by its potential significance, and lines extend the estimated liquidation zones for common high-leverage tiers — 100x, 50x, and 25x, long and short, each removable or customizable. Since markets tend to seek out these liquidity pools, the levels serve as both destinations and hazard zones.
How to Trade the Liquidation Levels?
- Bubbles: appear on bars where larger trading activity is detected; the bigger the bubble, the more significant the potential liquidation cluster.
- Level lines: each line attached to a bubble marks the price where a given leverage tier would be forced out — the liquidation zone at that price.
- Price attraction: price generally moves toward these zones, which makes untouched levels useful for framing targets, informed stop-loss placement, and areas where volatility may ignite.
The map doubles as a sentiment read: where the zones accumulate shows which side of the market is carrying the most leveraged risk.
Liquidation Levels Settings
- Reference Price: the base price the liquidation levels are calculated from.
- Volume Threshold: the primary trigger — how much trading activity a bar needs before levels are drawn from it.
- Volatility Threshold: a secondary trigger that qualifies sharp price moves even when trading activity is lower.
- Leverage Options: choose which leverage values are tracked and set colors for the resulting levels.
- Hide Liquidation Bubbles / Hide Liquidation Levels: toggle the bubbles and the zone lines independently.
Frequently Asked Questions
Why does price move toward liquidation levels?
Each level marks a dense cluster of leveraged positions that would be forced to close there. Markets in general gravitate toward such zones, which is exactly what makes untouched levels useful as targets and caution areas.
Can I combine it with swing-based liquidity tools?
Yes, and the pairing is natural: the Buyside & Sellside Liquidity indicator approaches the same magnet logic from swing structure, while Liquidation Levels derives its zones from leverage math around high-activity bars. Confluence between the two flags a level worth taking seriously.
How do I access the Liquidation Levels indicator?
Free, via the LuxAlgo Library. It can also be run in Quant, LuxAlgo's AI, directly from this page to see how the levels behave on your market.
Free indicator
Get free access to this indicator on the platforms below.

The Library is free. Quant makes it yours.
Pull any concept or indicator into Quant: rebuild it, retune it, or turn it into a backtested strategy of your own.