Accelerator Oscillator
 By LuxAlgoApr 13, 2020
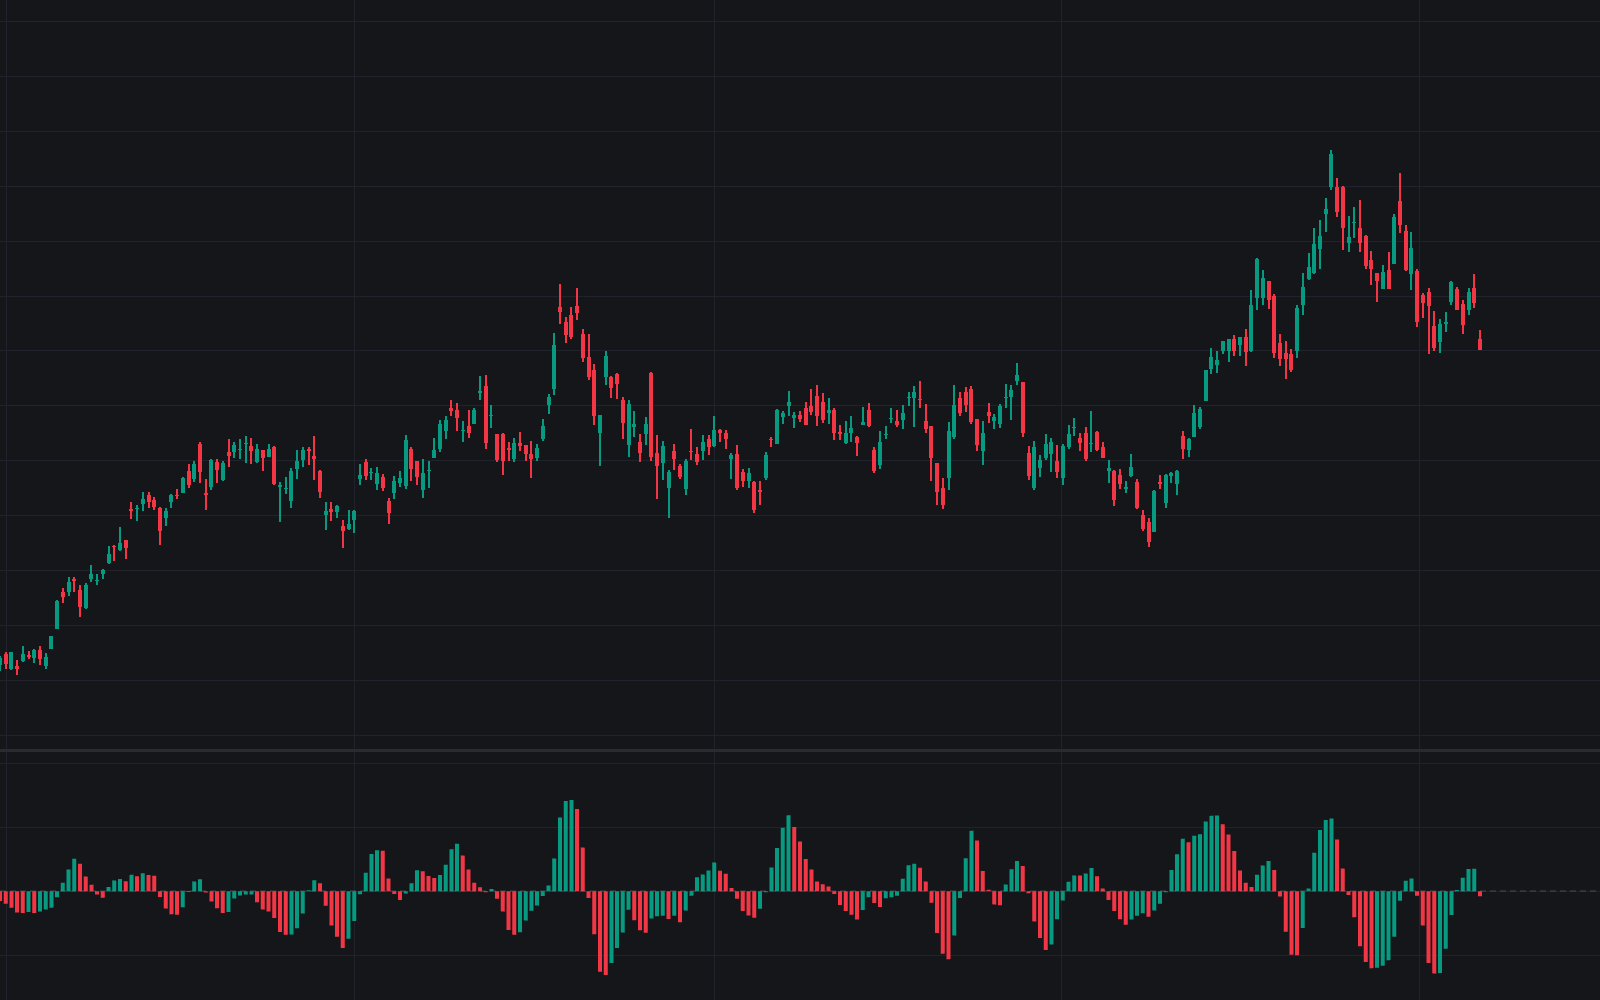

The Accelerator Oscillator measures whether momentum is speeding up or slowing down by subtracting a 5-period simple moving average of the Awesome Oscillator from the AO itself, plotted as a zero-centered histogram. Bill Williams designed it to shift direction ahead of both momentum and price, and fixed its arithmetic accordingly. This build keeps the classic 5/34/5 parameters.
How to Trade the Accelerator Oscillator?
- Two rising columns above zero: Williams' minimum condition for a buy when the histogram already sits on the bullish side of the zero line.
- Three rising columns below zero: buying from the bearish side of zero demands an extra column of confirmation; sells mirror both rules.
- Falling columns above zero: upside force fading inside a still-positive regime, a caution flag for longs, not an automatic sell.
- Shrinking peaks at new price highs: a fresh price extreme with a smaller AC peak than the one before shows thrust thinning behind the move.
- Zero line position: the histogram's sign shows which side the added force currently favors.
One color change on its own means little. Williams' rules always demand consecutive columns. Two alert conditions, Zero Cross Up and Zero Cross Down, fire when the histogram changes sign.
Accelerator Oscillator Settings
The arithmetic is fixed by definition (a 5/34 Awesome Oscillator minus its own 5-period average), so the build exposes no numeric inputs, only presentation:
- Rising / Falling / Zero Line: the histogram's two comparison colors and the reference line. The rising color applies whenever a column exceeds the one before it, regardless of sign.
Frequently Asked Questions

The Library is free. Quant makes it yours.
Pull any concept or indicator into Quant: rebuild it, retune it, or turn it into a backtested strategy of your own.