Concept
Accelerator Oscillator
Accelerator Oscillator is a Momentum & Oscillators concept. The Library holds 1 implementation, a working definition you can pull into Quant.
The standard Accelerator Oscillator indicator
Accelerator Oscillator exactly as classically defined: the faithful reference build of the original formula, free to run in Quant.
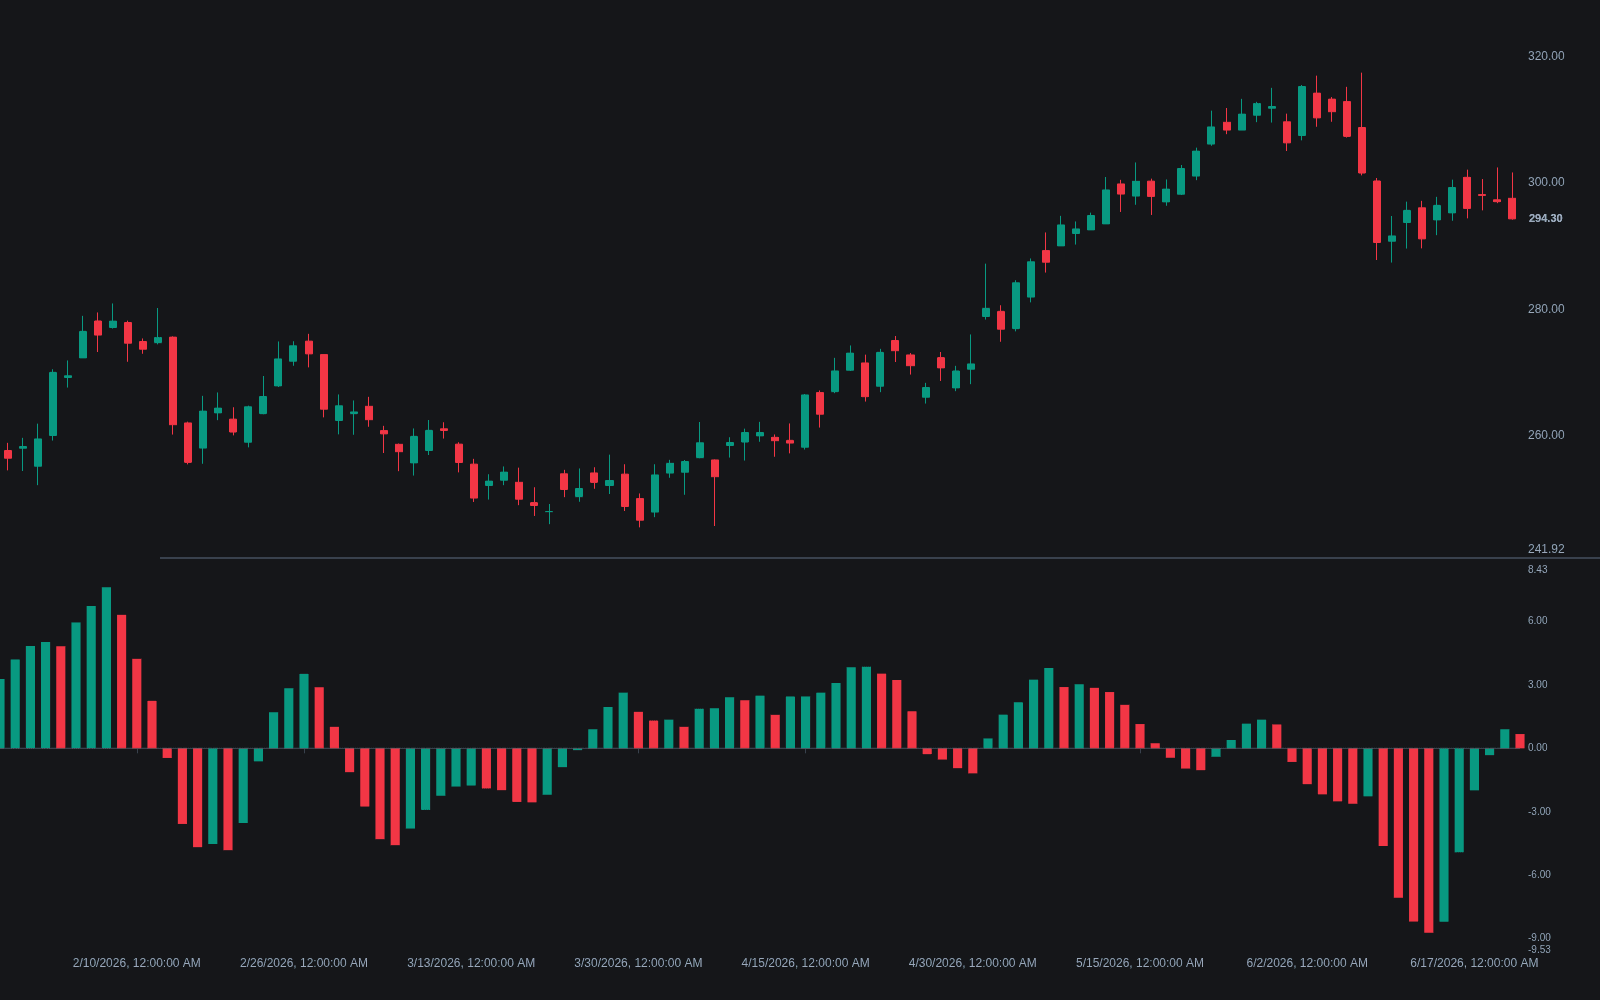
What is the Accelerator Oscillator?
The Accelerator Oscillator (AC) is Bill Williams' measure of momentum's acceleration. It takes the Awesome Oscillator (the 5-period simple moving average of median price minus the 34-period one) and subtracts a 5-period simple moving average of that oscillator from it. What remains is the change in the driving force rather than the force itself. Williams' premise: price is the last thing to change, momentum changes before price, and acceleration changes before momentum, so AC is meant to turn earliest of the three.
AC plots as a zero-centered histogram, conventionally colored by whether each bar is higher or lower than the previous one. Rising bars above zero read as accelerating upside pressure; falling bars below zero as accelerating downside pressure. Because it is built entirely from moving averages of median price, it remains a smoothed, lagging statistic: a single color flip is common noise, not proof of a turn.
Williams introduced the Accelerator alongside the Awesome Oscillator in New Trading Dimensions (1998), extending the Profitunity method begun in Trading Chaos (1995); there it sits beside the Alligator and fractal breakouts as one input in a checklist rather than a standalone system. The design leans on a driving metaphor: momentum is the market's speed, AC the change in that speed, the foot easing off the accelerator before the car visibly slows. Metaphor aside, the arithmetic is just an oscillator minus its own signal average.
Williams' entry rules are deliberately asymmetric around zero: a buy with AC above the zero line requires two consecutive rising columns, a buy from below zero requires three, and sells mirror this, the extra column compensating for trading against the indicated regime. The limits are plain too: everything is an average of past median prices, so the acceleration it reports arrives with lag, and the output is unbounded, price-scaled, without fixed overbought or oversold levels, and prone to whipsaw in flat markets.
How to read the Accelerator Oscillator on a chart
AC is read from column-to-column change, the zero line, and divergence, in that order.
- 1Note the zero line first: columns above zero indicate acceleration favoring the bulls, columns below zero acceleration favoring the bears.
- 2Read color as comparison, not sign: a column is green when higher than the previous column and red when lower, so a green column can print below zero and a red one above it.
- 3Track runs, not single bars: two or more consecutive columns in one direction is the minimum Williams' rules act on; one flip is routine noise.
- 4At fresh price extremes, compare the new AC peak with the prior one: a smaller peak against a more extreme price is the deceleration warning that precedes many turns, though not all.
How it's calculated
Bill Williams' histogram measuring whether momentum, taken as the Awesome Oscillator, is accelerating or decelerating.
Bill Williams' definition fixes the 5 and 34 bar lengths; platforms rarely expose them as inputs.
AC is the gap between AO and its own 5-bar average, so it typically turns before AO itself.
Plotted as a histogram colored by bar-to-bar change: green when AC_t > AC_(t-1), red when lower.
How traders use it
- As a permission filter over directional entries: Williams' rules require consecutive rising bars before a buy and consecutive falling bars before a sell, and demand an extra confirming bar when the trade is taken from the wrong side of the zero line.
- As a deceleration warning: shrinking bars while price grinds to fresh highs or lows show the move's force fading, often ahead of a turn in the Awesome Oscillator itself.
- As a divergence tool: regular divergences between AC extremes and price extremes are used to anticipate exhaustion, normally with structural confirmation before acting.
- As a throttle over other systems: some traders only take longs while AC is rising or above zero, letting the acceleration read veto entries from structure, MACD, or moving-average setups.
- Alongside bounded oscillators: because AC has no fixed scale, pairing it with RSI or the Stochastic Oscillator supplies the overbought and oversold context AC cannot provide.
Accelerator Oscillator vs other momentum tools
MACD: The MACD histogram plots the MACD line minus its signal line, the same trick AC performs on the Awesome Oscillator: a momentum measure minus its own average. The difference is the inputs, EMAs of the close there, SMAs of the bar midpoint here.
Momentum: Momentum measures the change in price over a lookback, a first derivative. AC sits one derivative higher, tracking whether that force is growing or fading, earlier in principle and noisier in practice.
RSI: RSI is bounded between 0 and 100 and read against fixed thresholds, which suits mean-reversion framing. AC is unbounded, read only against its own recent columns and the zero line, which suits regime and timing filters.
Concept family
Momentum & Oscillators
91 concepts mapped · 91 in the Library
Accelerator Oscillator FAQ
Turn Accelerator Oscillator into a trading strategy.
Take the implementation from this page into Quant, then build on it, backtest it on real data, and keep refining it in conversation.