AMD POC Trade Setup
 By LuxAlgoSep 23, 2026
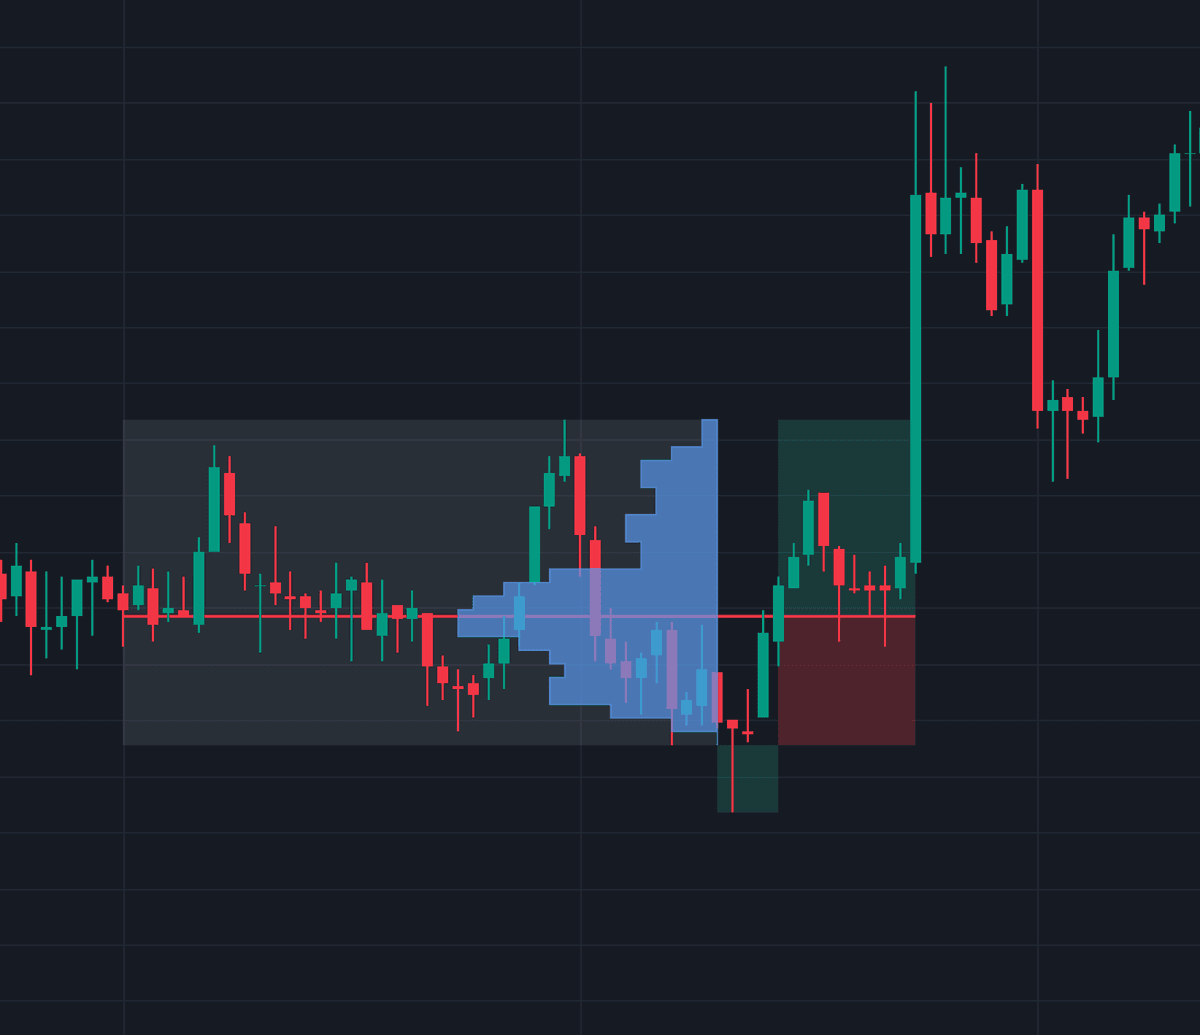

The AMD POC Trade Setup is a technical indicator designed to identify market structural shifts based on the classic Accumulation, Manipulation, and Distribution framework. By analyzing localized volume profiles, the tool pinpoints the Point of Control within an accumulation range and alerts traders to potential trend reversals after a manipulation move. This systematic approach helps traders filter out market noise and focus on high-probability setups where price sweeps liquidity before moving rapidly in the intended direction.
How to Trade the AMD POC Trade Setup?
To effectively use this tool, observe the three distinct phases highlighted on your chart. First, the indicator identifies a period of consolidation, known as accumulation, where price stays within a tight range. During this time, the indicator calculates a volume profile to locate the Point of Control, representing the price level with the highest transaction volume.
The second phase, manipulation, occurs when price pushes outside the accumulation range to sweep liquidity. A valid setup triggers when price reverses and breaks back through the Point of Control with significant momentum. The indicator evaluates the strength of this breakout by checking the candle body size and the position of the close relative to the range, ensuring that the move is not just a fakeout.
When a valid signal occurs, the indicator displays the entry point at the Point of Control, along with visual boxes for the projected Take Profit and Stop Loss levels. For a bearish setup, look for a sweep of the accumulation high followed by a strong close below the Point of Control. For a bullish setup, seek a sweep of the accumulation low followed by a decisive close above the Point of Control. Always assess the broader trend and current volatility before entering, as these setups perform best when aligned with existing market structure.
AMD POC Trade Setup Settings
AMD Logic
- Accumulation Length (Bars): The number of chart bars used to identify the tight consolidation range.
- Accumulation Range Max %: The maximum percentage height permitted for the accumulation zone.
- Normalize Range Threshold: If enabled, adjusts the percentage threshold based on the square root of the timeframe to maintain consistency across different intervals.
- Normalization Reference Timeframe: The base timeframe used to calculate the range threshold.
- Max Search Window: The maximum number of bars allowed after accumulation for a manipulation move and subsequent breakout to occur.
POC Break Confirmation
- Minimum POC Break (ATR): The required distance the close must move beyond the Point of Control to confirm the breakout.
- Minimum Break Candle Body (ATR): The minimum required size of the breakout candle body relative to its ATR.
- Break Candle Close Strength: Defines how close to the extreme of the candle the price must close to be considered a strong breakout.
Accumulation Volume Profile
- Volume Profile Rows: The number of horizontal price rows used to build the volume profile.
- Maximum Profile Width: The maximum horizontal length of the profile when rendered on the chart.
- Show Accumulation Volume Profile: Toggles the display of the volume profile box for visual reference.
Sessions
- Session Toggles: Enables or disables detection within specific market sessions, including Sydney, Tokyo, London, and New York.
- Highlight Active Session Time: Visually tints the background to indicate when the chosen sessions are active.
Frequently Asked Questions

The Library is free. Quant makes it yours.
Pull any concept or indicator into Quant: rebuild it, retune it, or turn it into a backtested strategy of your own.