Astro Cycles
 By LuxAlgoJun 14, 2026
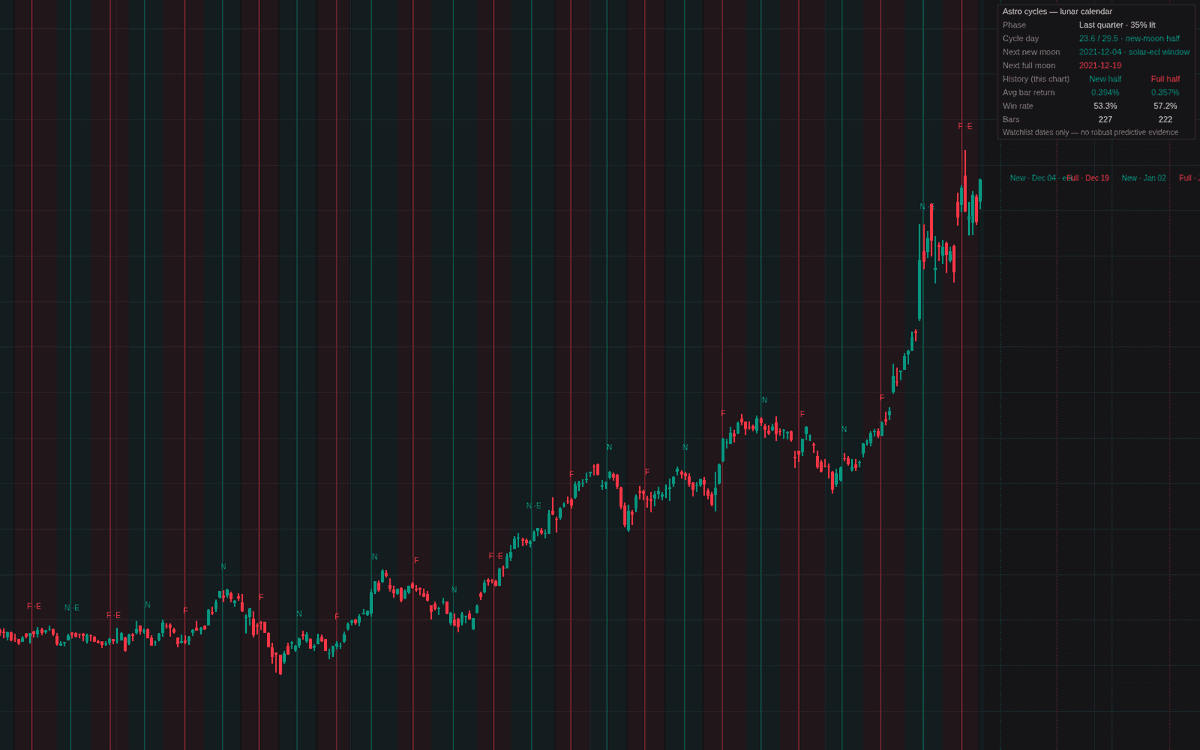

Astro Cycles is a precision lunar calendar for charts, built to test rather than assume the claims of astro cycles: every new and full moon is placed at its exact astronomical time from the standard lunation series, eclipse-window events are tagged, and the next several events are projected past the last bar, dates computable years in advance.
The build keeps the calendar and the claim separate. Shading splits each lunation into new-moon and full-moon halves, and the dashboard reports a descriptive split of the chart's own bar returns between those halves: a built-in null-hypothesis check of the claimed lunar rhythm, not an endorsement of it.
How to Trade the Astro Cycles?
- N and F lines: exact new and full moon times; treat them as watchlist dates for price-action evidence, never as signals.
- ·E tag: the event falls near a lunar node, where a solar (new moon) or lunar (full moon) eclipse is possible.
- Lunar-half shading: marks the claimed-favorable new-moon half and claimed-cautious full-moon half. Check the dashboard's split before giving it weight.
- Projected dotted lines: the upcoming events, placed on the chart ahead of time.
Astro Cycles Settings
- New moons and Full moons (default on): vertical lines at each event's exact time.
- Event labels (default on): tiny N/F tags whose tooltips carry the exact UTC time.
- Tag eclipse windows (default on): applies the standard quick node test (|sin F| below 0.36).
- Upcoming events (default 4): future events projected past the last bar as dotted lines.
- Shade lunar halves (default on): the half-cycle background tint, active on timeframes up to weekly.
- Show dashboard (default on) plus position, size, event colors and Shading transparency (default 94).
Frequently Asked Questions

The Library is free. Quant makes it yours.
Pull any concept or indicator into Quant: rebuild it, retune it, or turn it into a backtested strategy of your own.